OSINT Analysis & Visualizations
Charts and visualizations from the Iran-Israel OSINT dataset, organized by topic. Click any chart to view full size. See also the reports library.
Charts generated: 2026-03-05 UTC. These charts reflect data available at the time of generation and may be outdated.
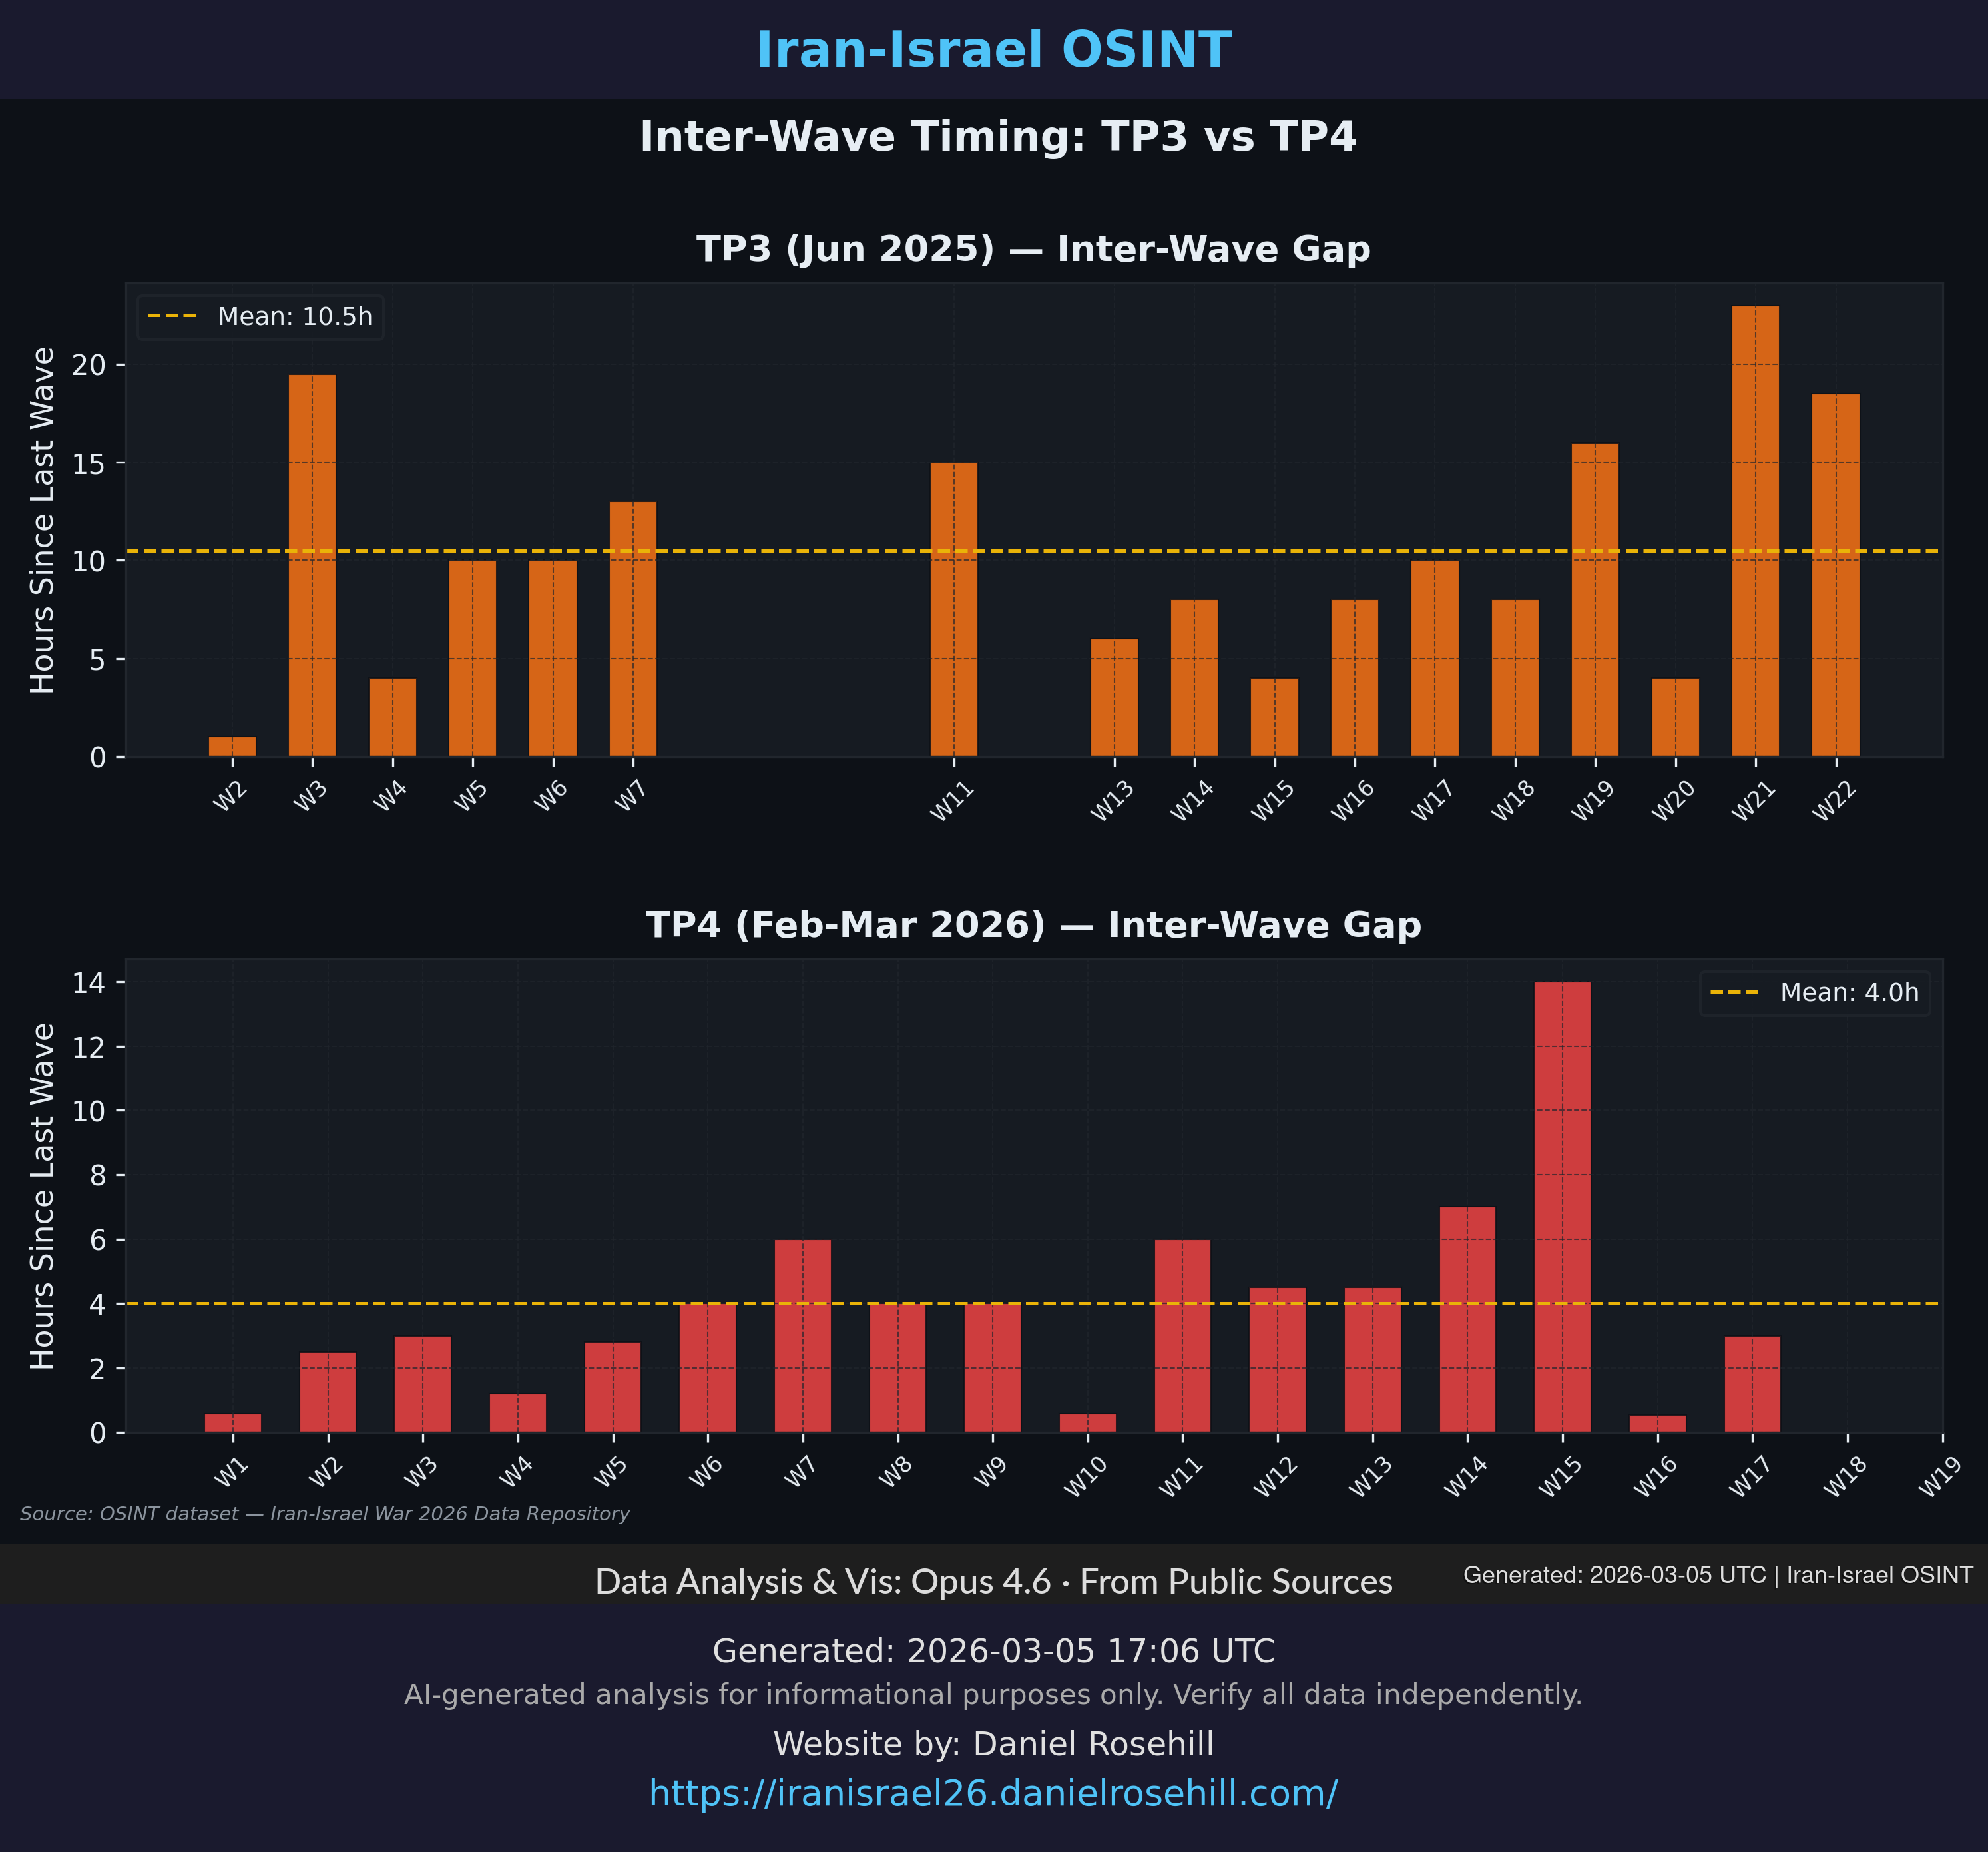
Inter-Wave Timing
Hours between consecutive attack waves within each operation. Shows acceleration patterns as operations progress.
Timing Generated: 2026-03-05 UTC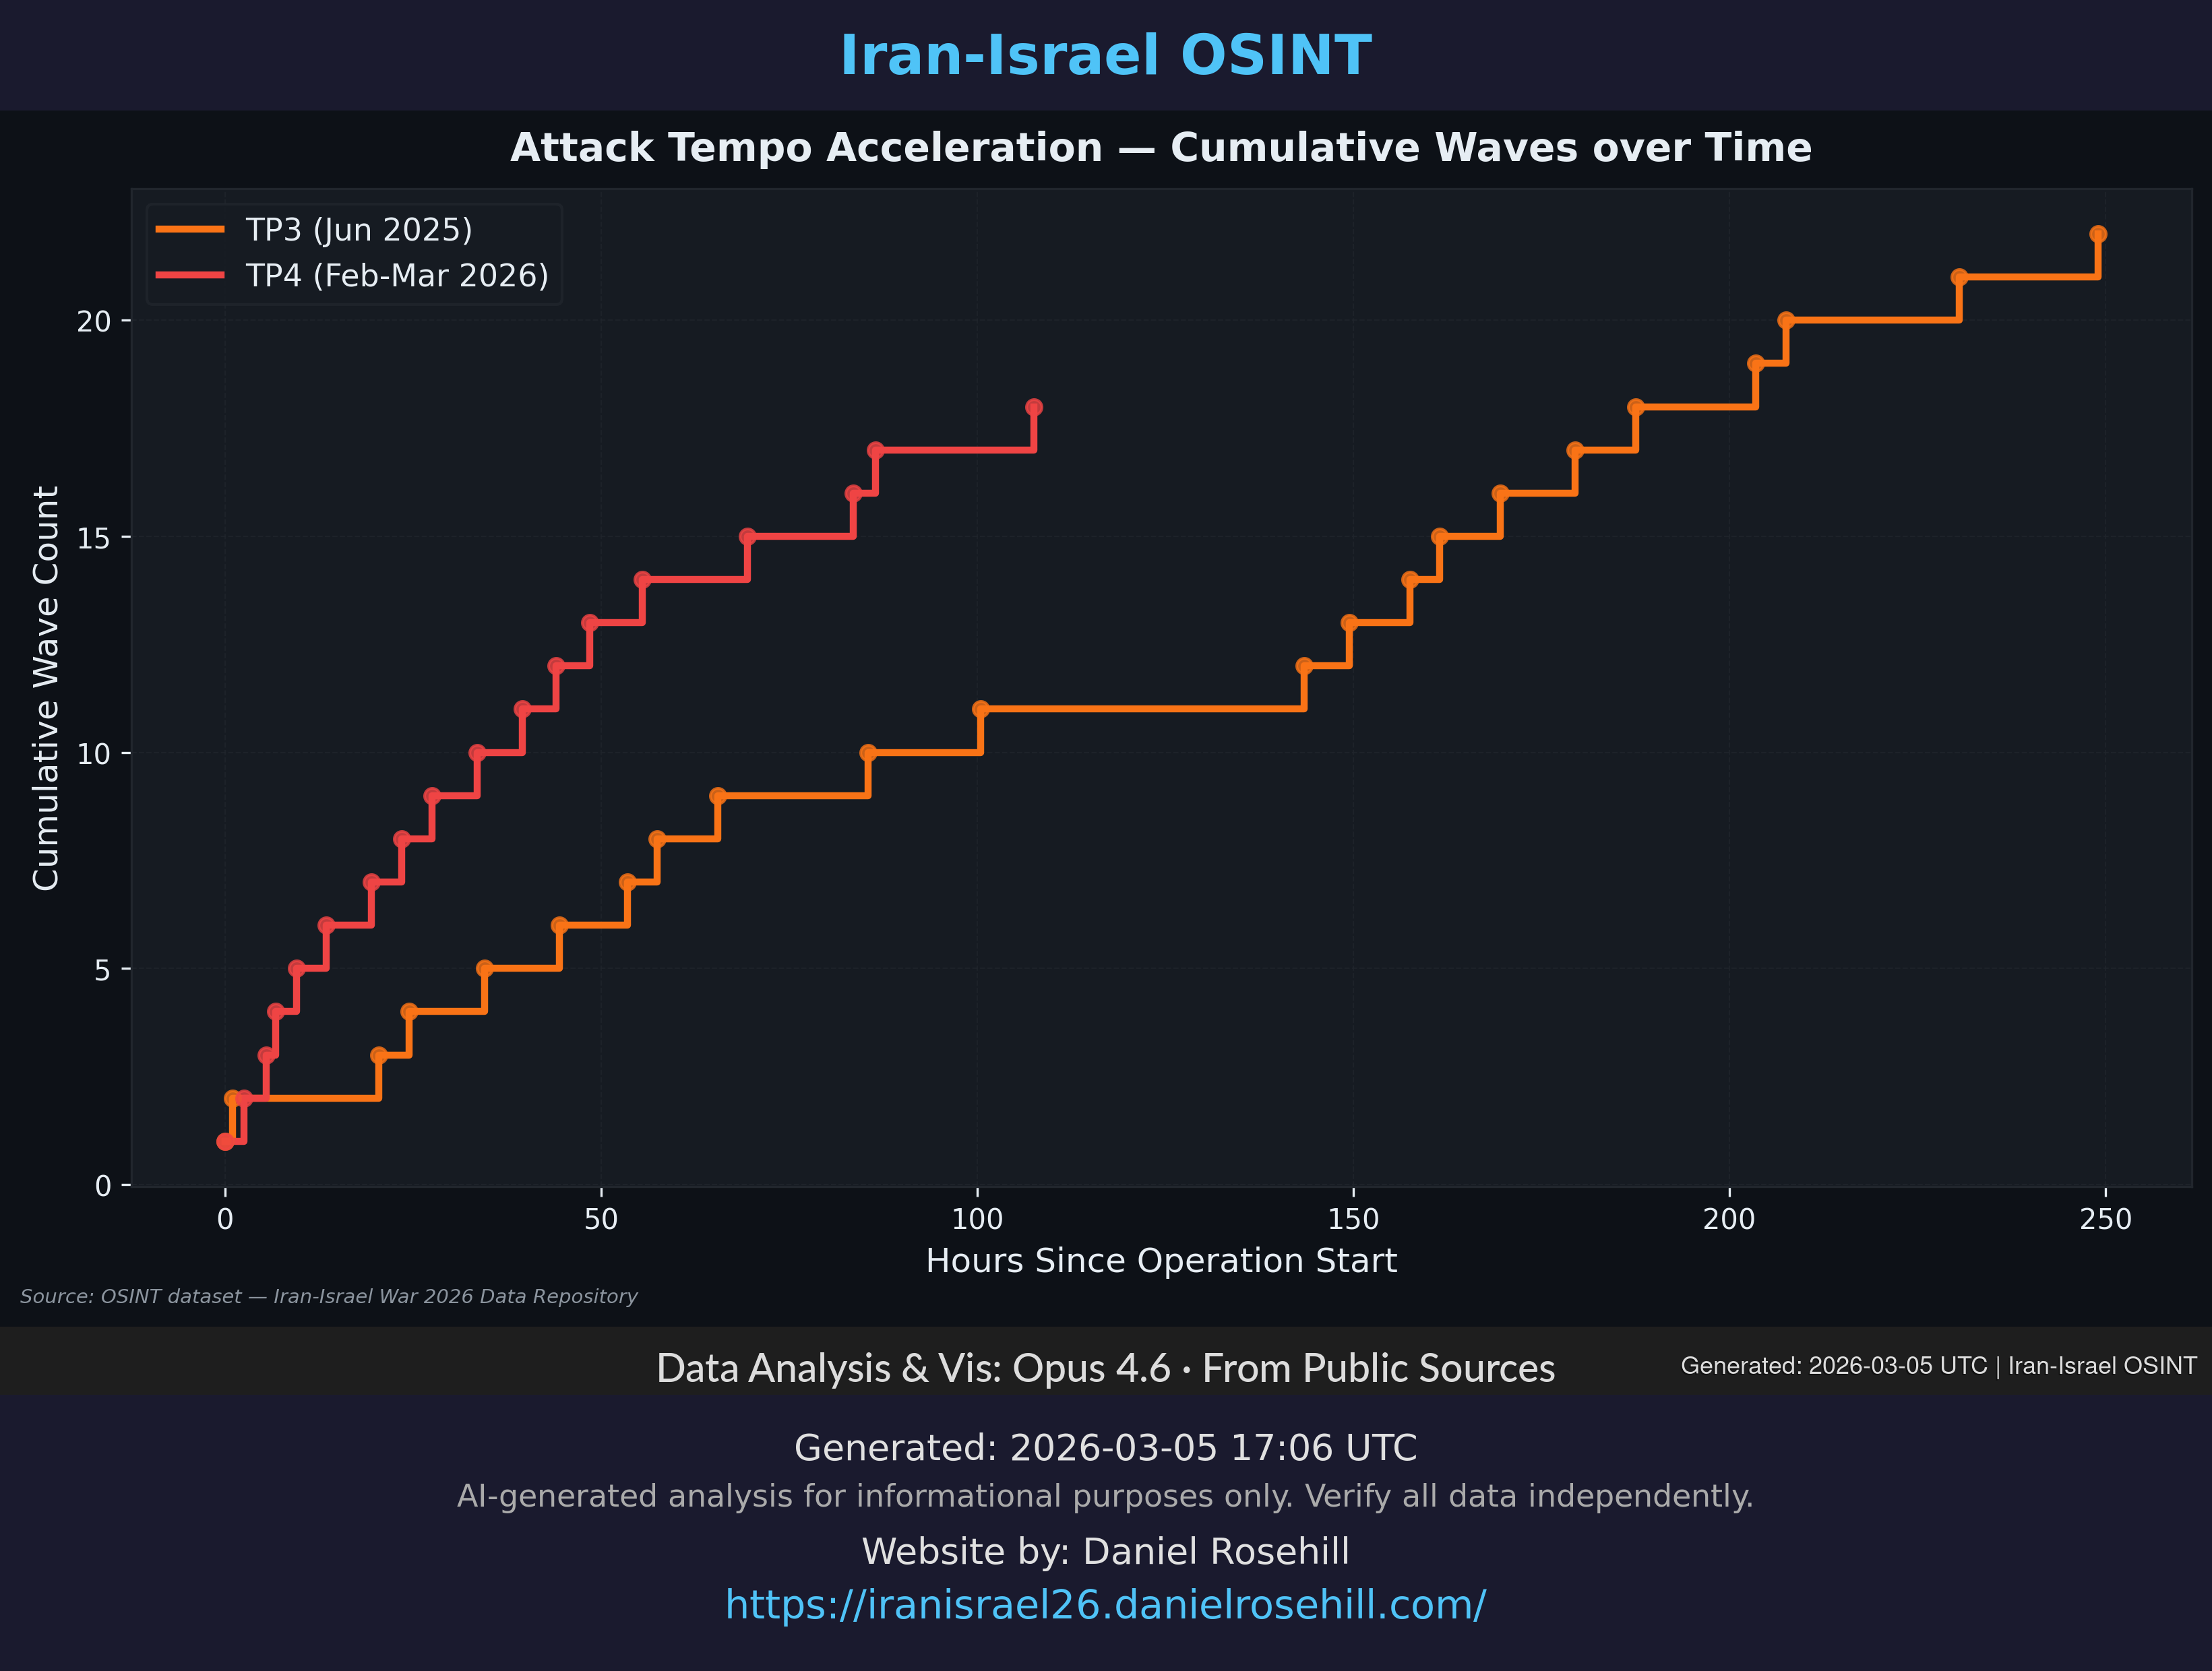
Tempo Acceleration
How attack tempo changes over the course of each operation — from initial probing to sustained bombardment.
Timing Generated: 2026-03-05 UTC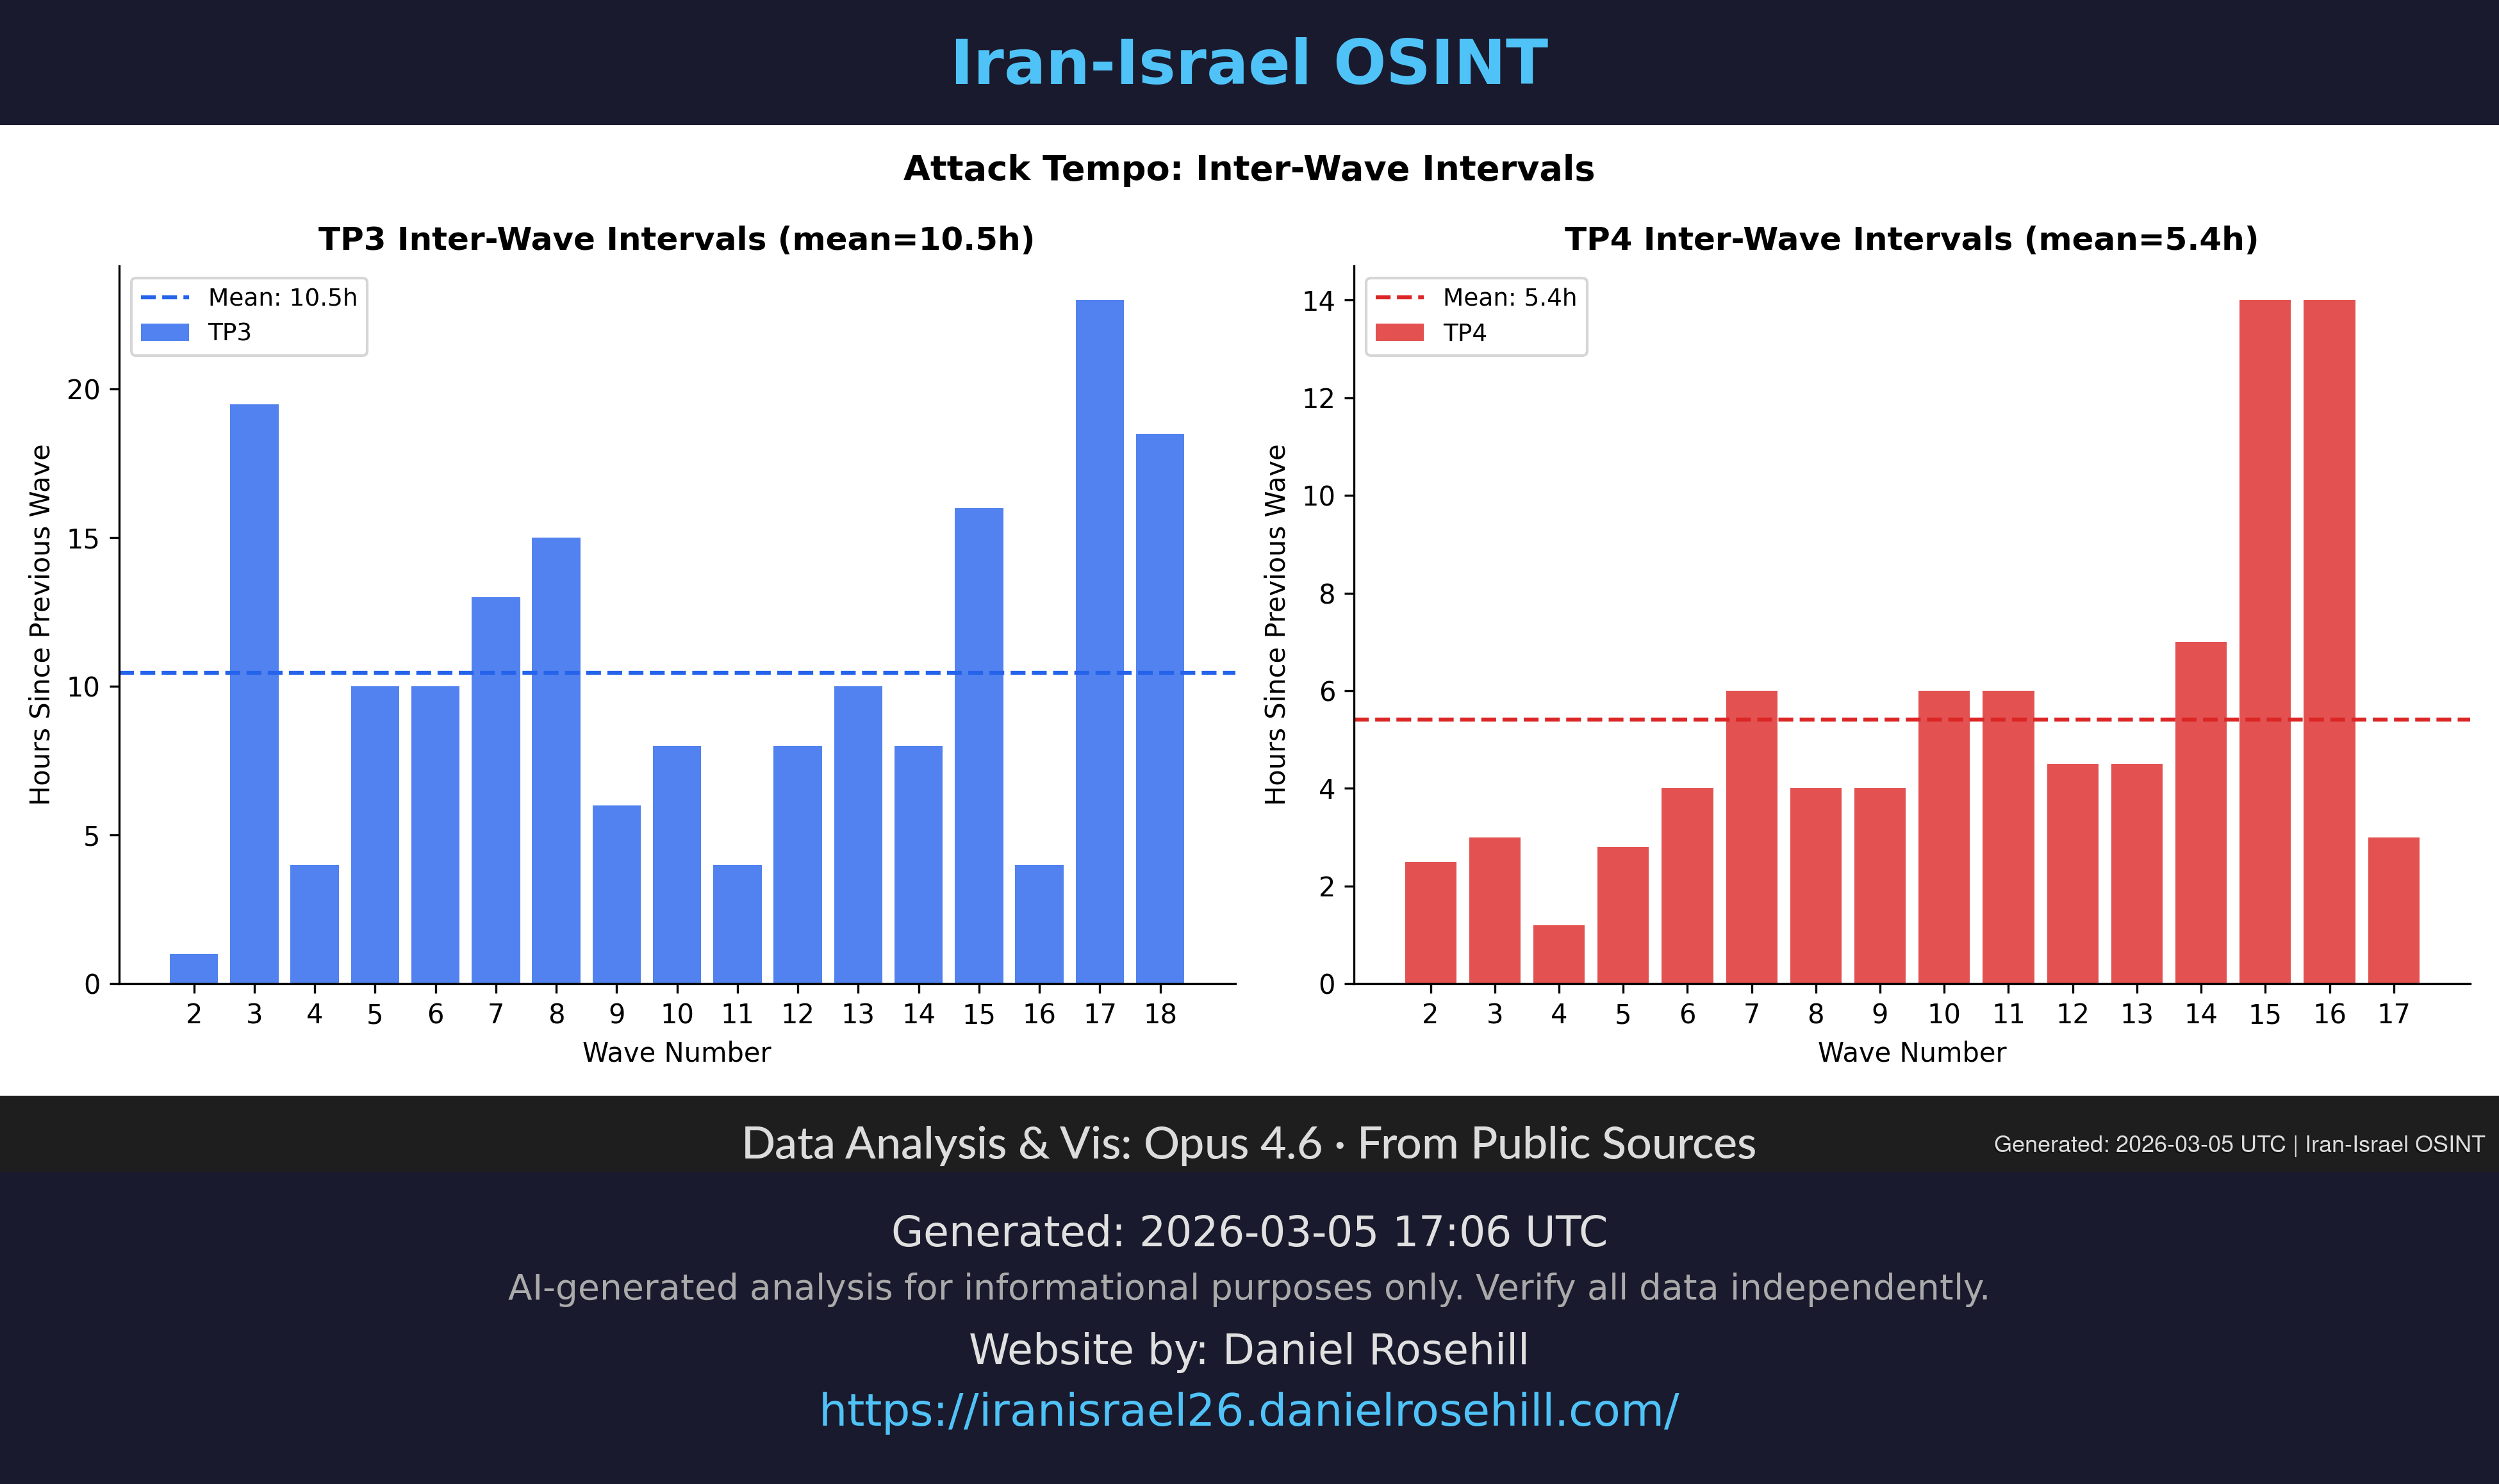
TP3 vs TP4 Tempo Comparison
Comparative tempo analysis between the Twelve-Day War (TP3) and the ongoing TP4 operation.
Timing Generated: 2026-03-05 UTC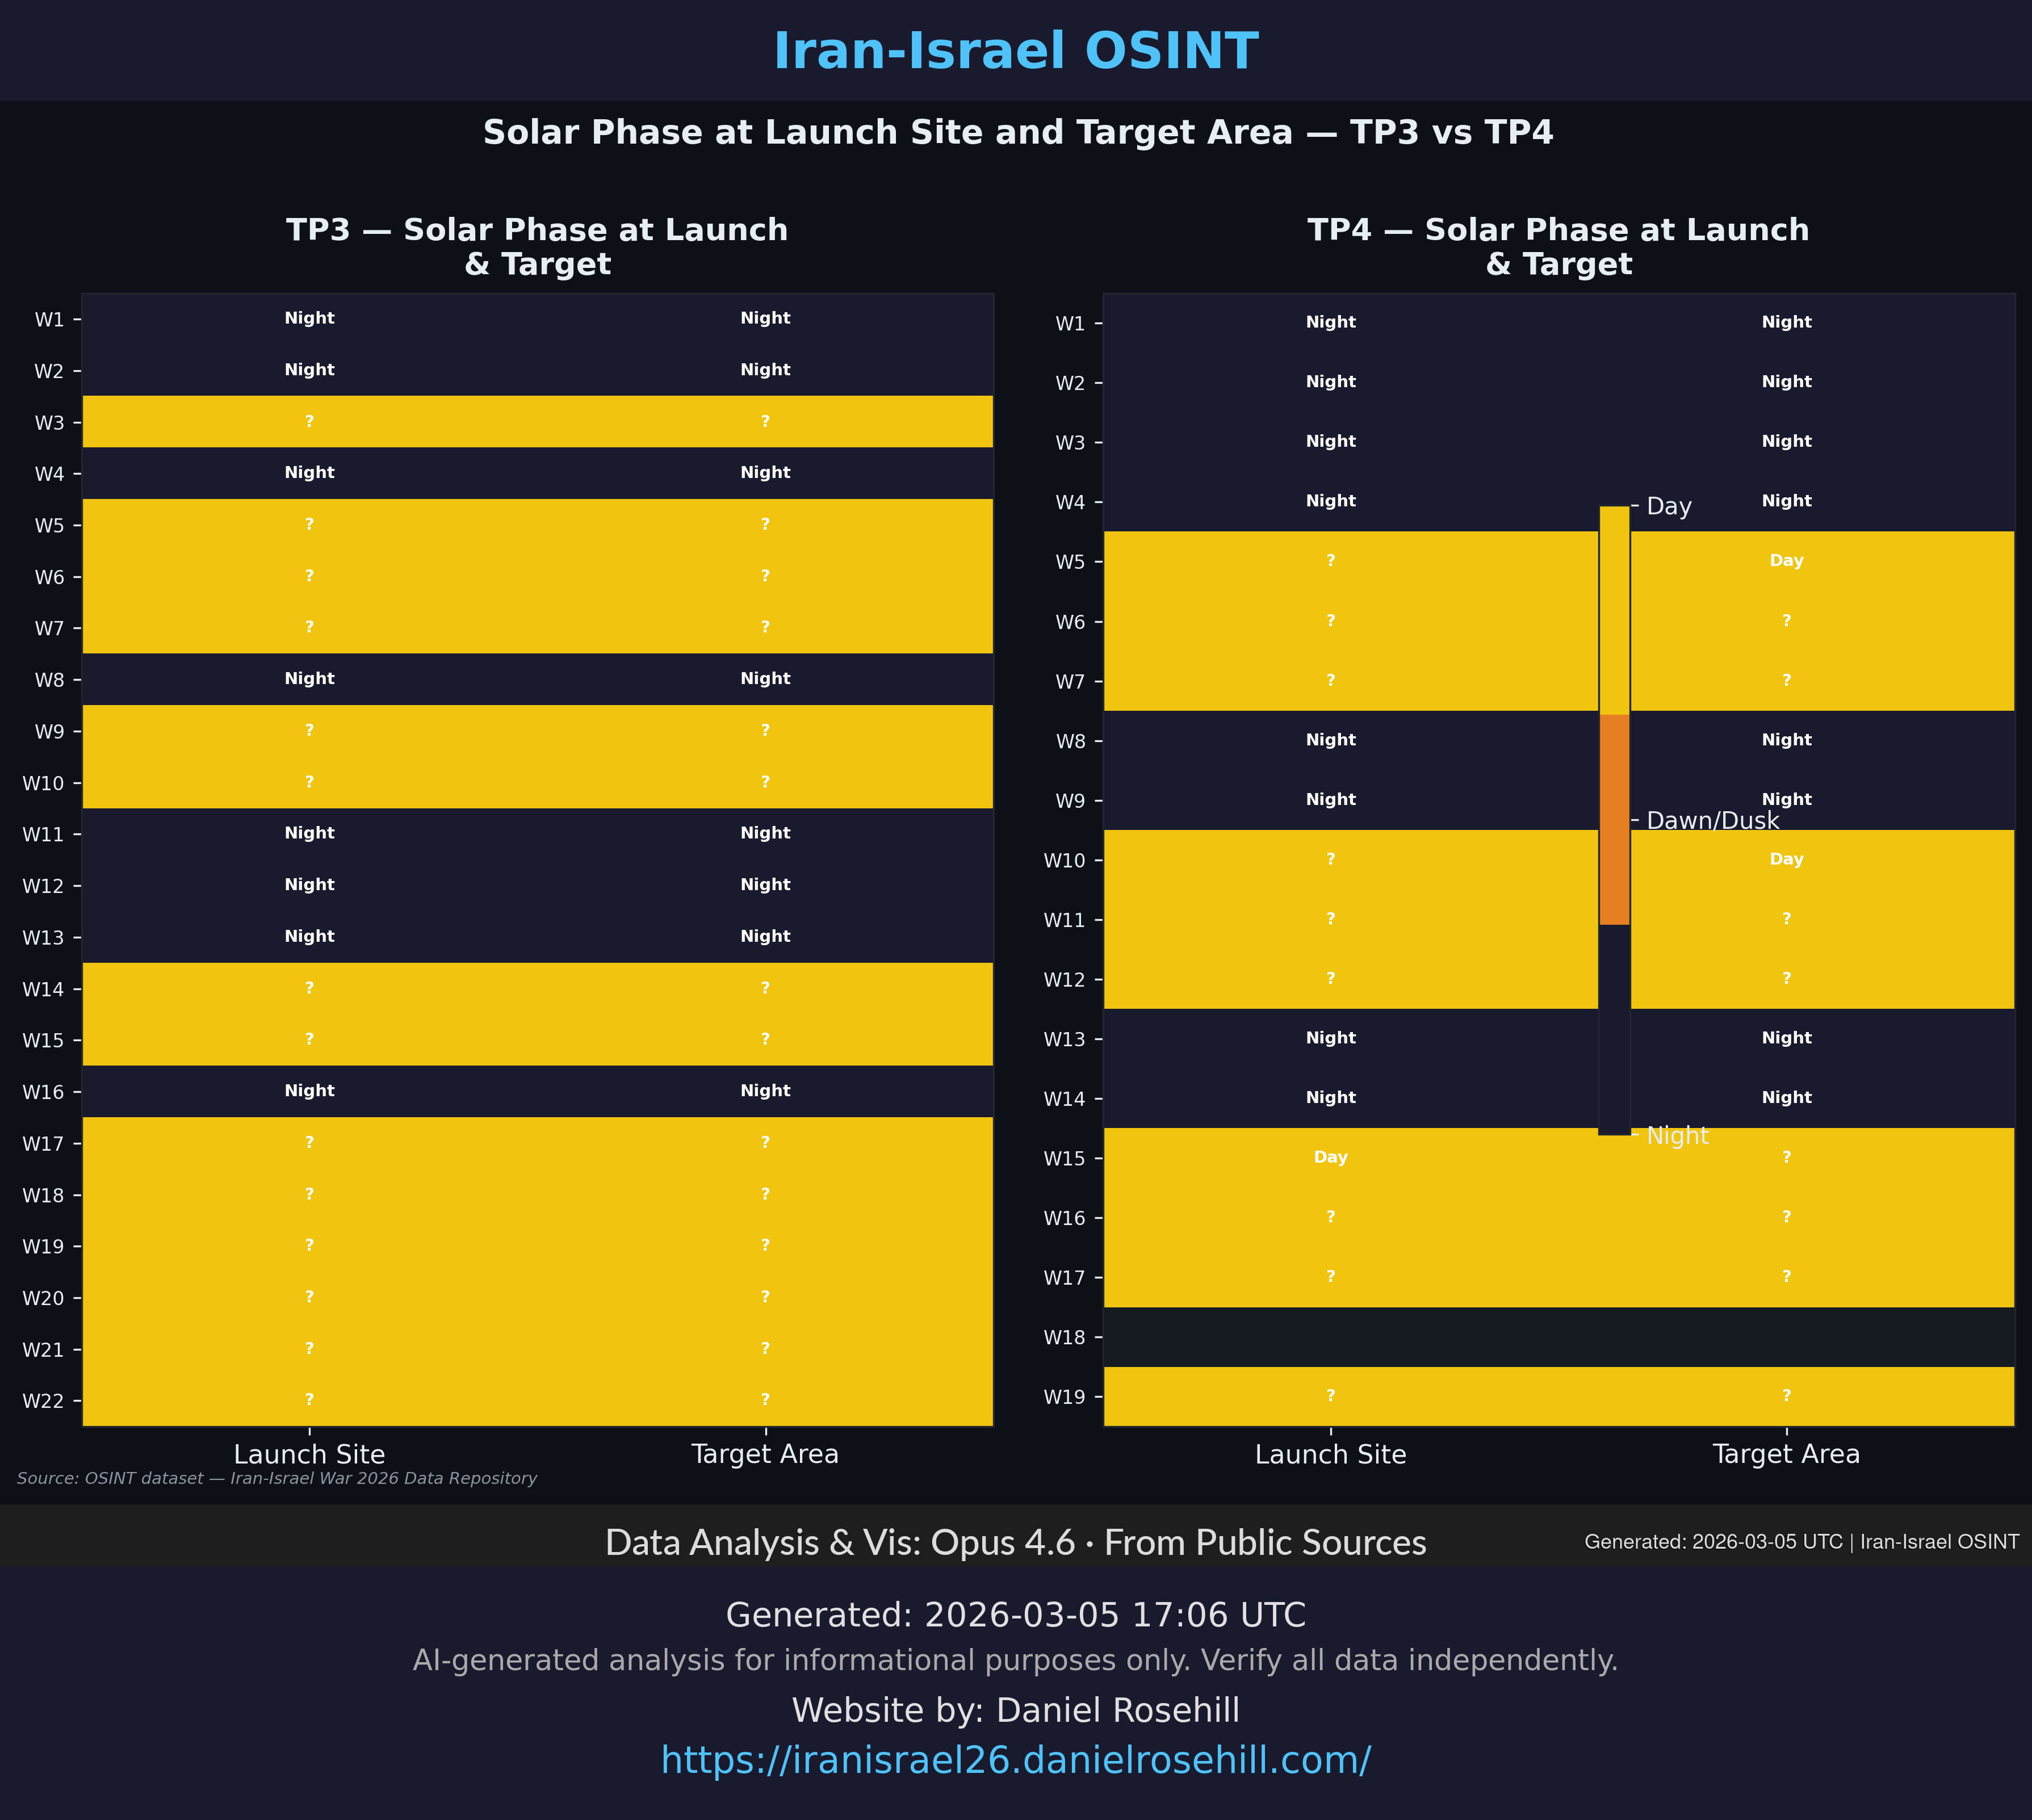
Solar Phase Heatmap
When attacks launch relative to daylight at launch sites — reveals preference for night launches.
Timing Generated: 2026-03-05 UTC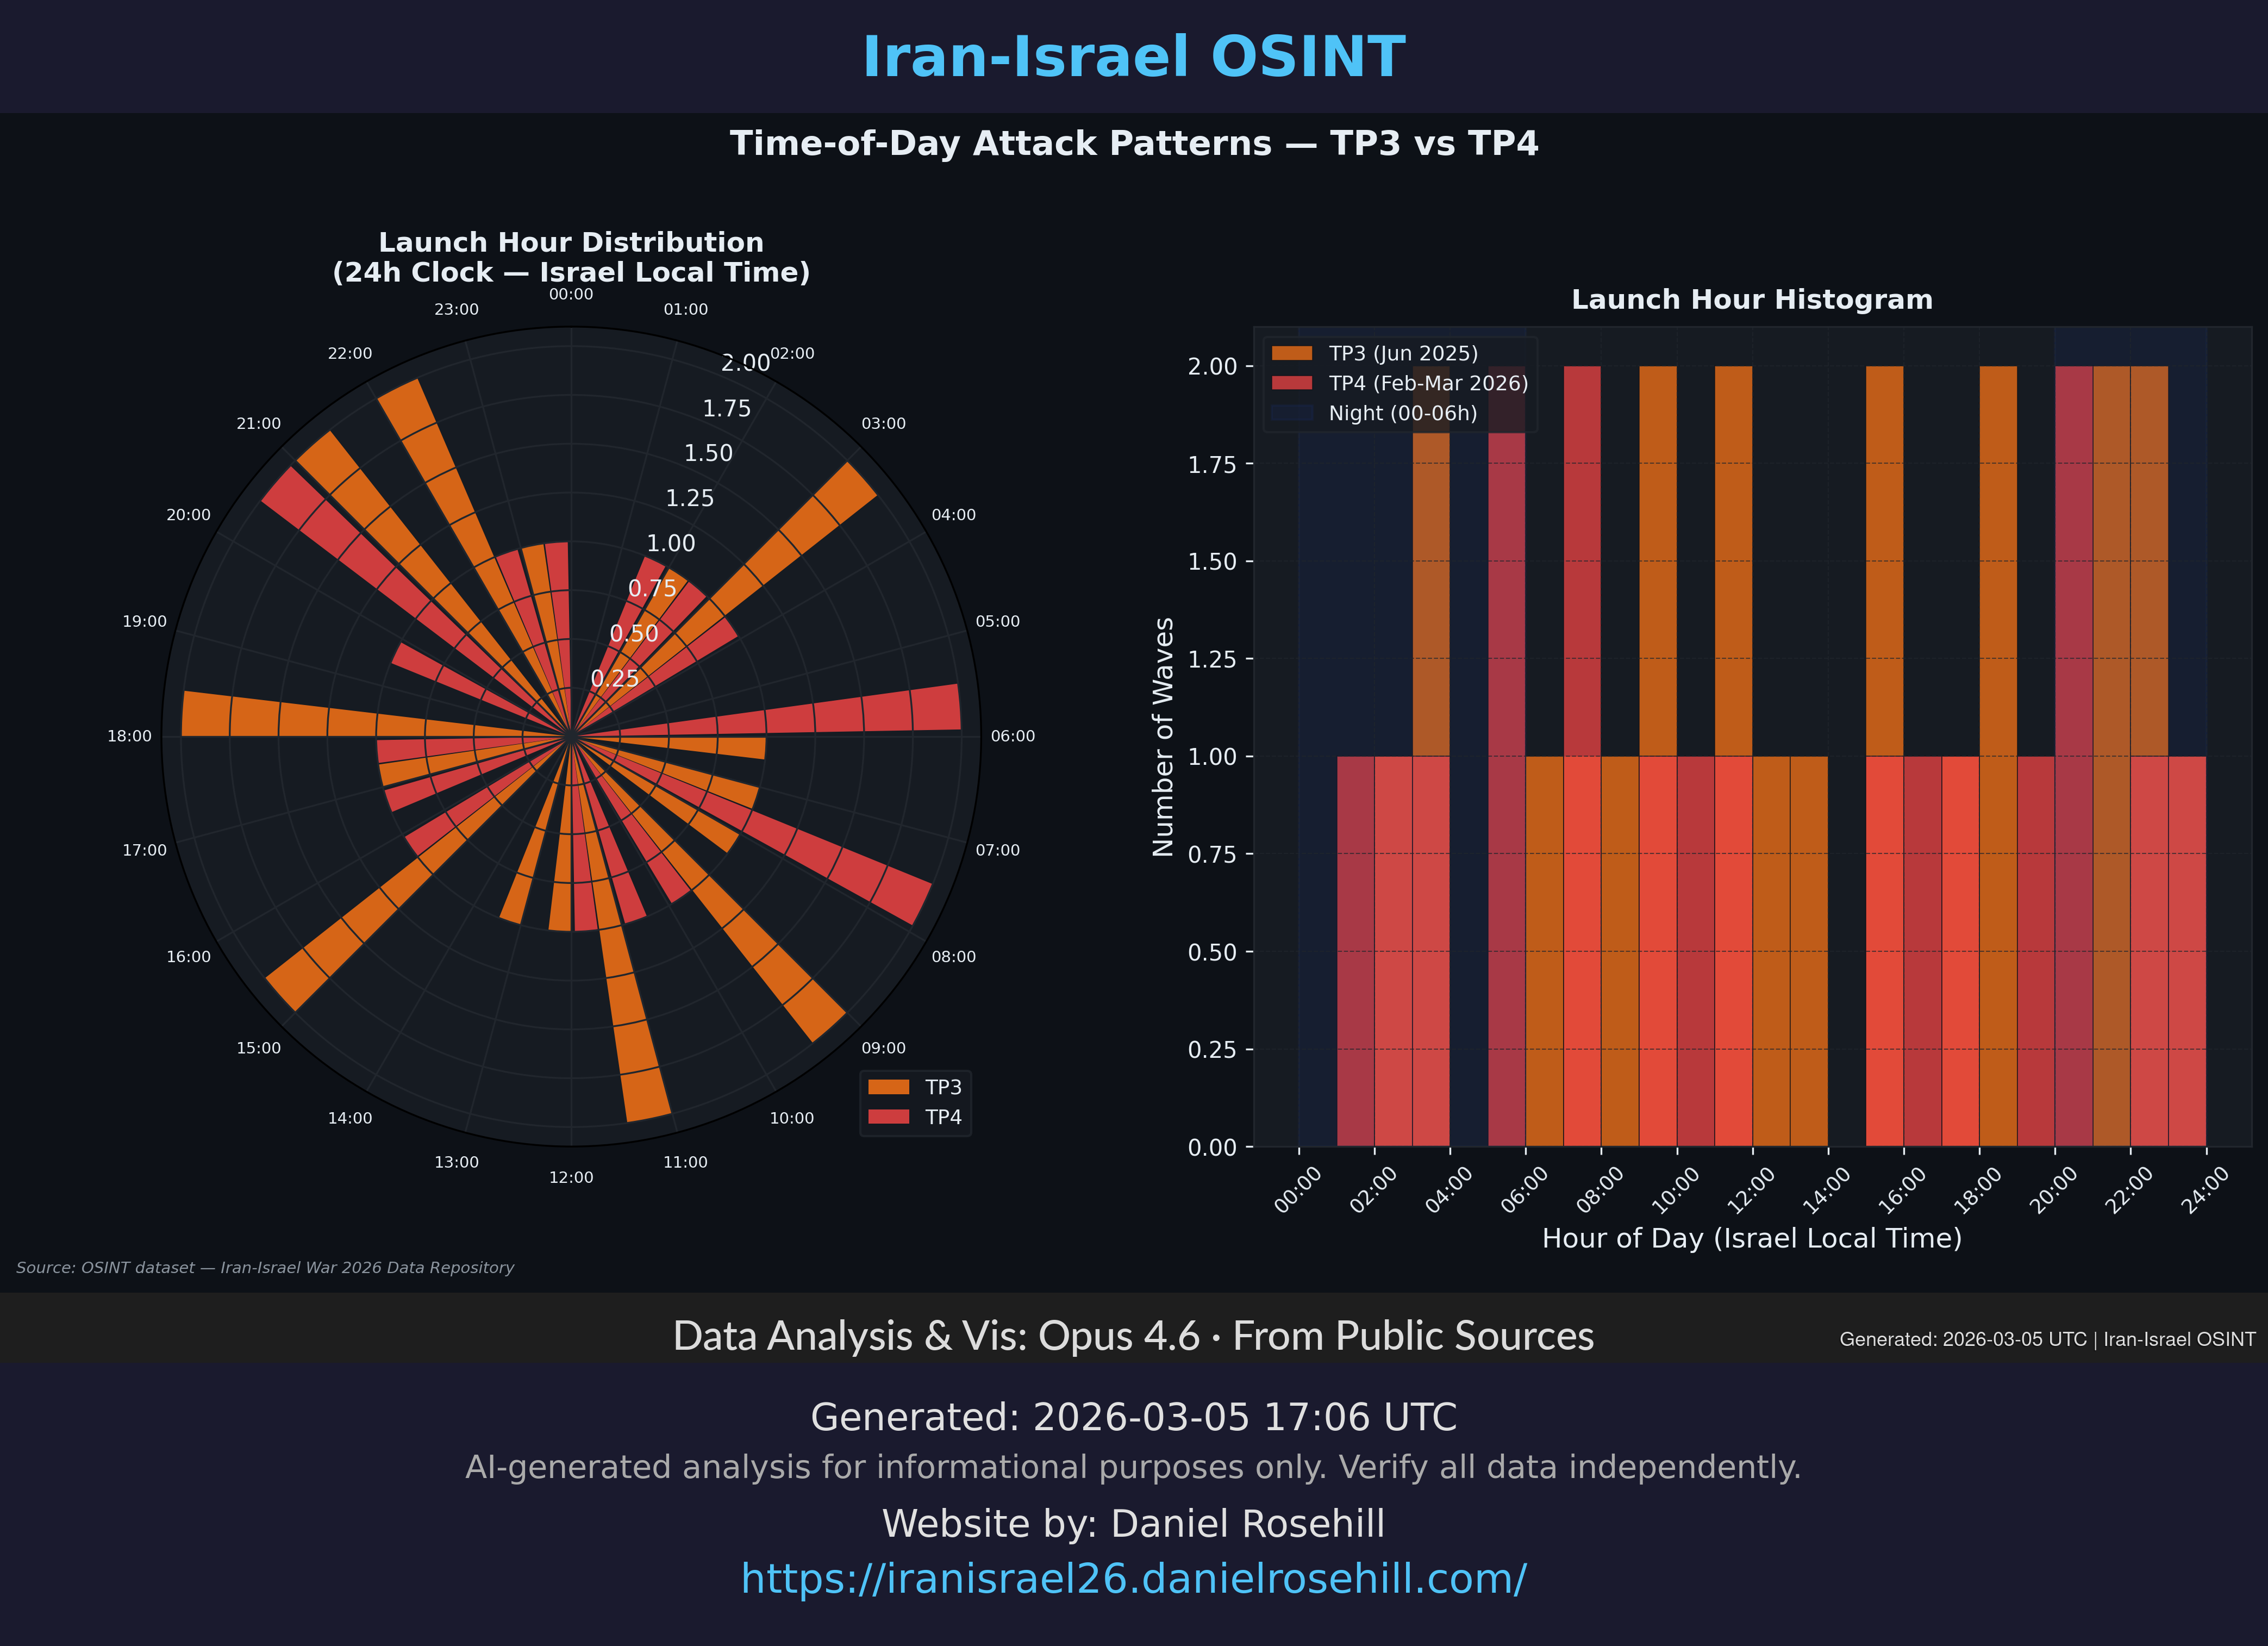
Hour of Day Distribution
Distribution of attack wave launch times by hour (UTC). Shows tactical timing preferences.
Timing Generated: 2026-03-05 UTC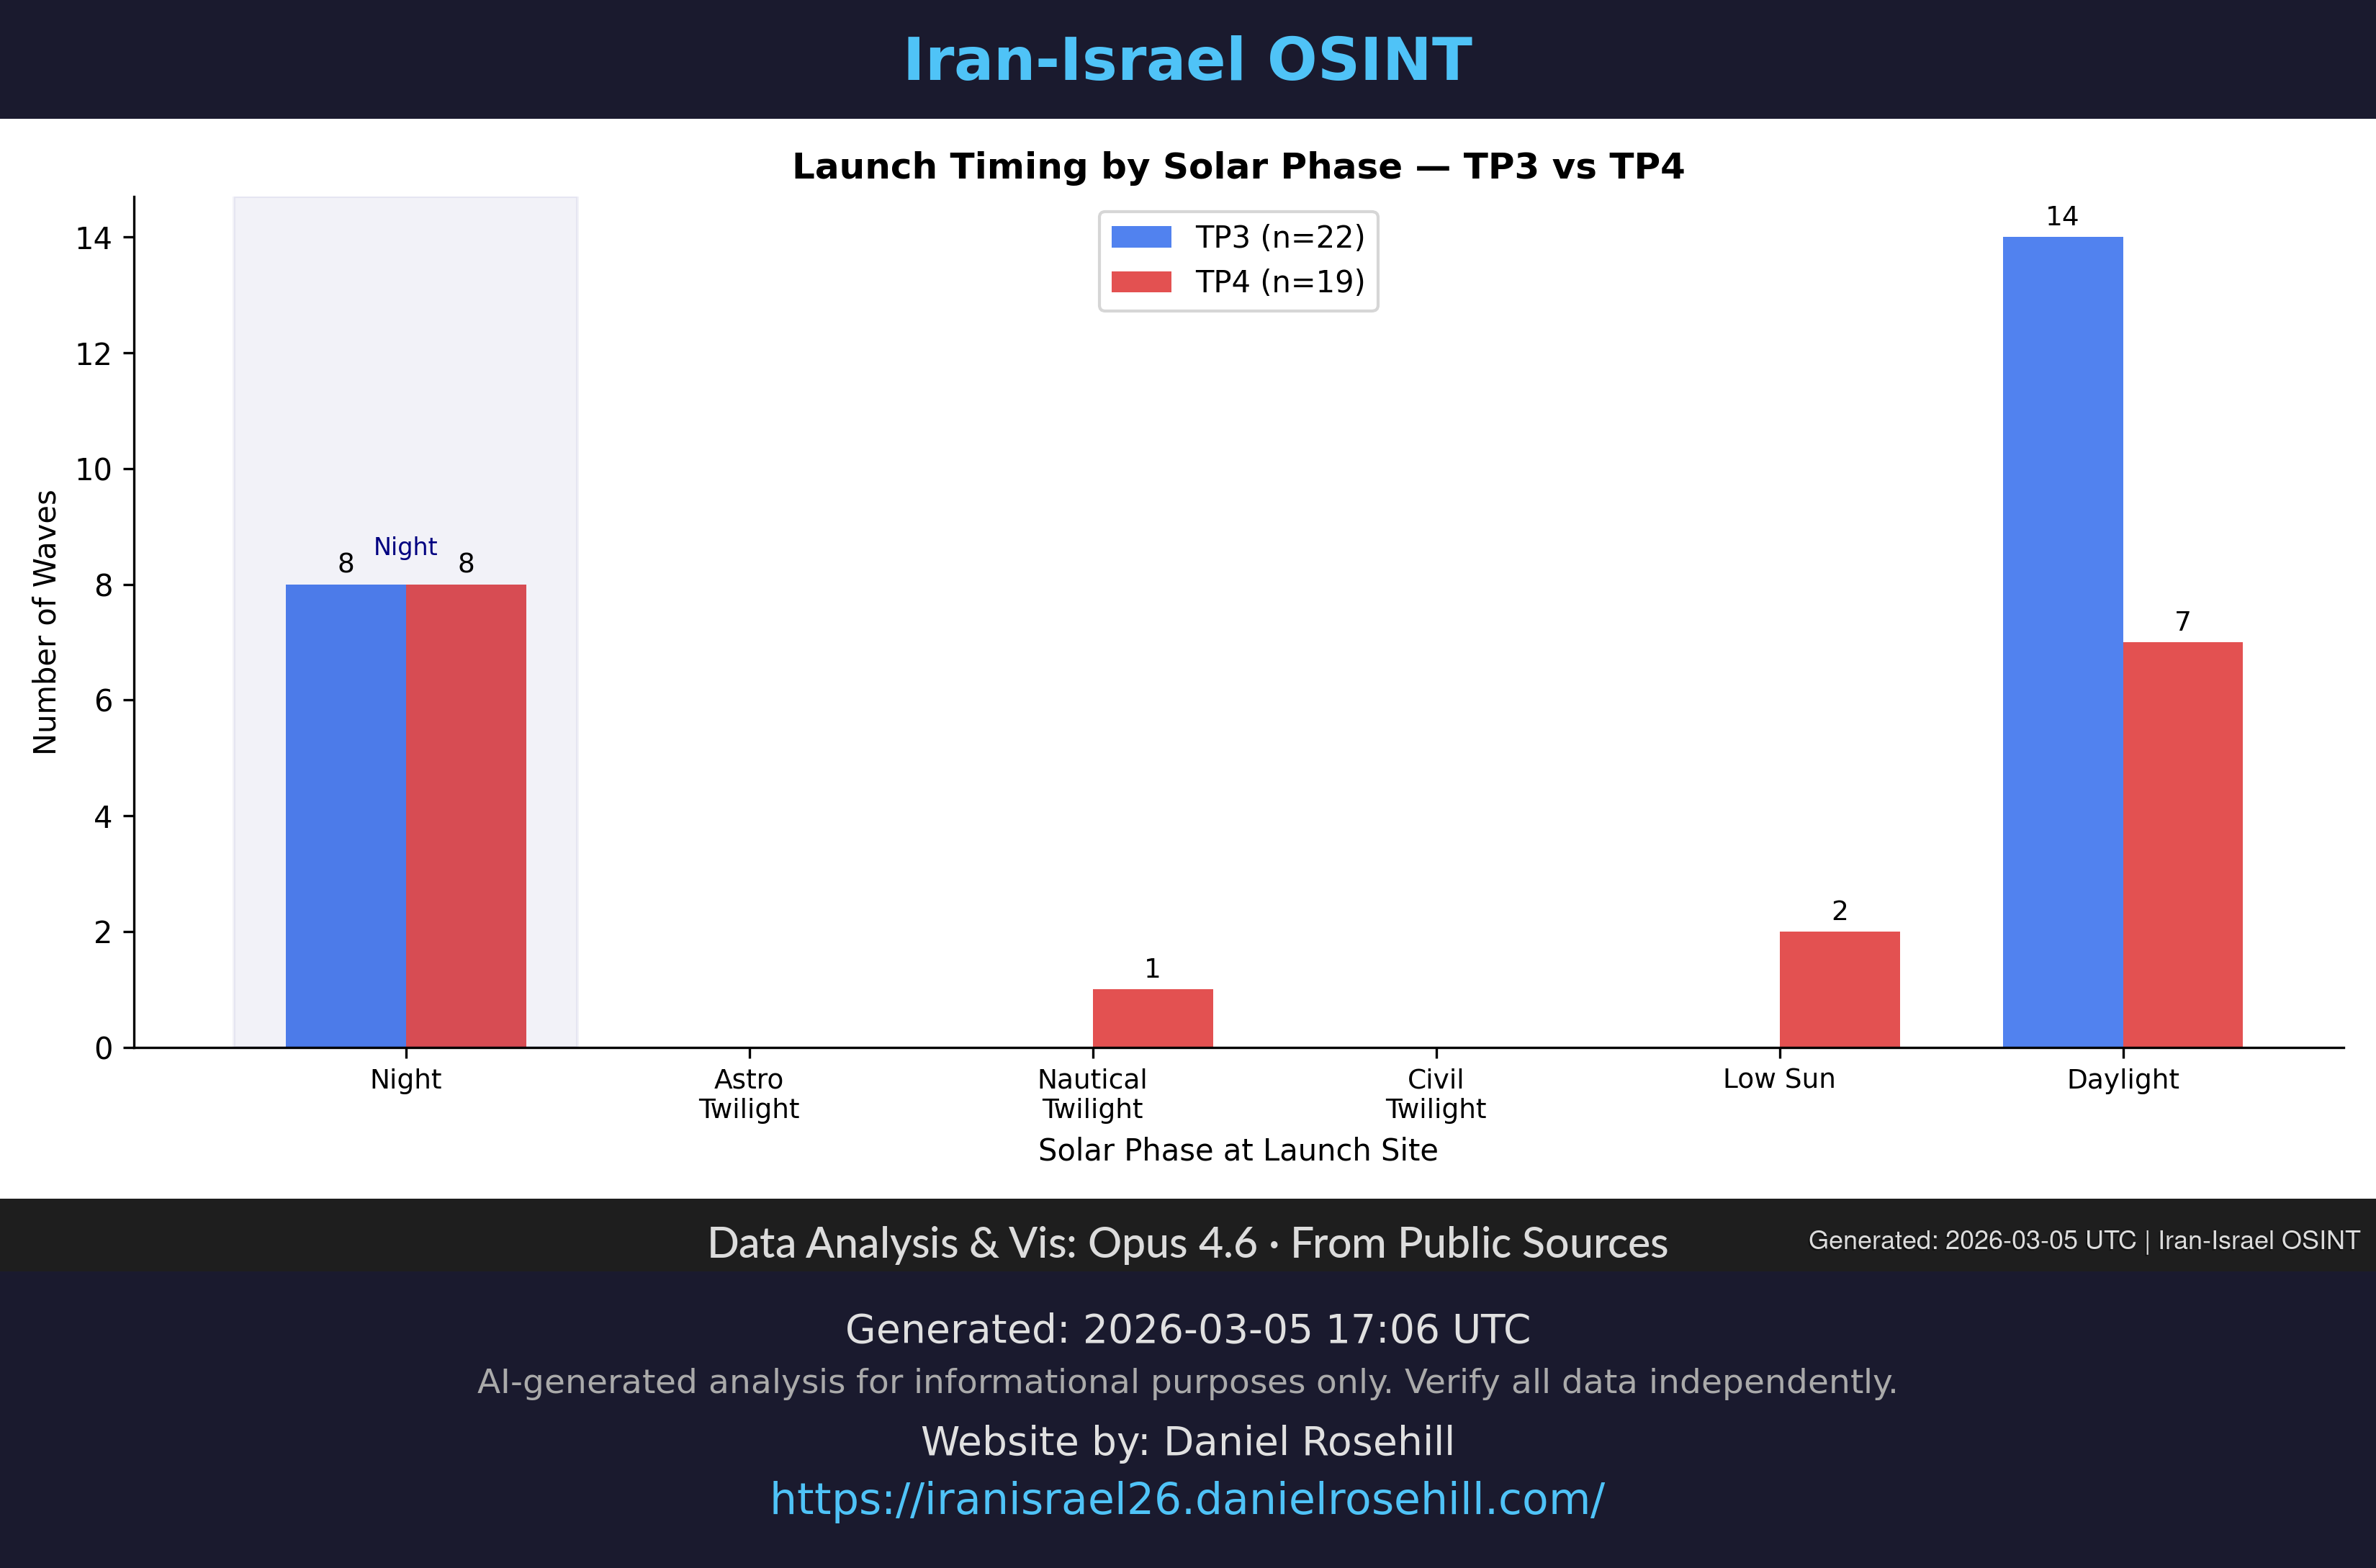
Night vs Day Launch Patterns
Breakdown of night vs. daytime launches across TP3 and TP4, showing tactical evolution.
Timing Generated: 2026-03-05 UTC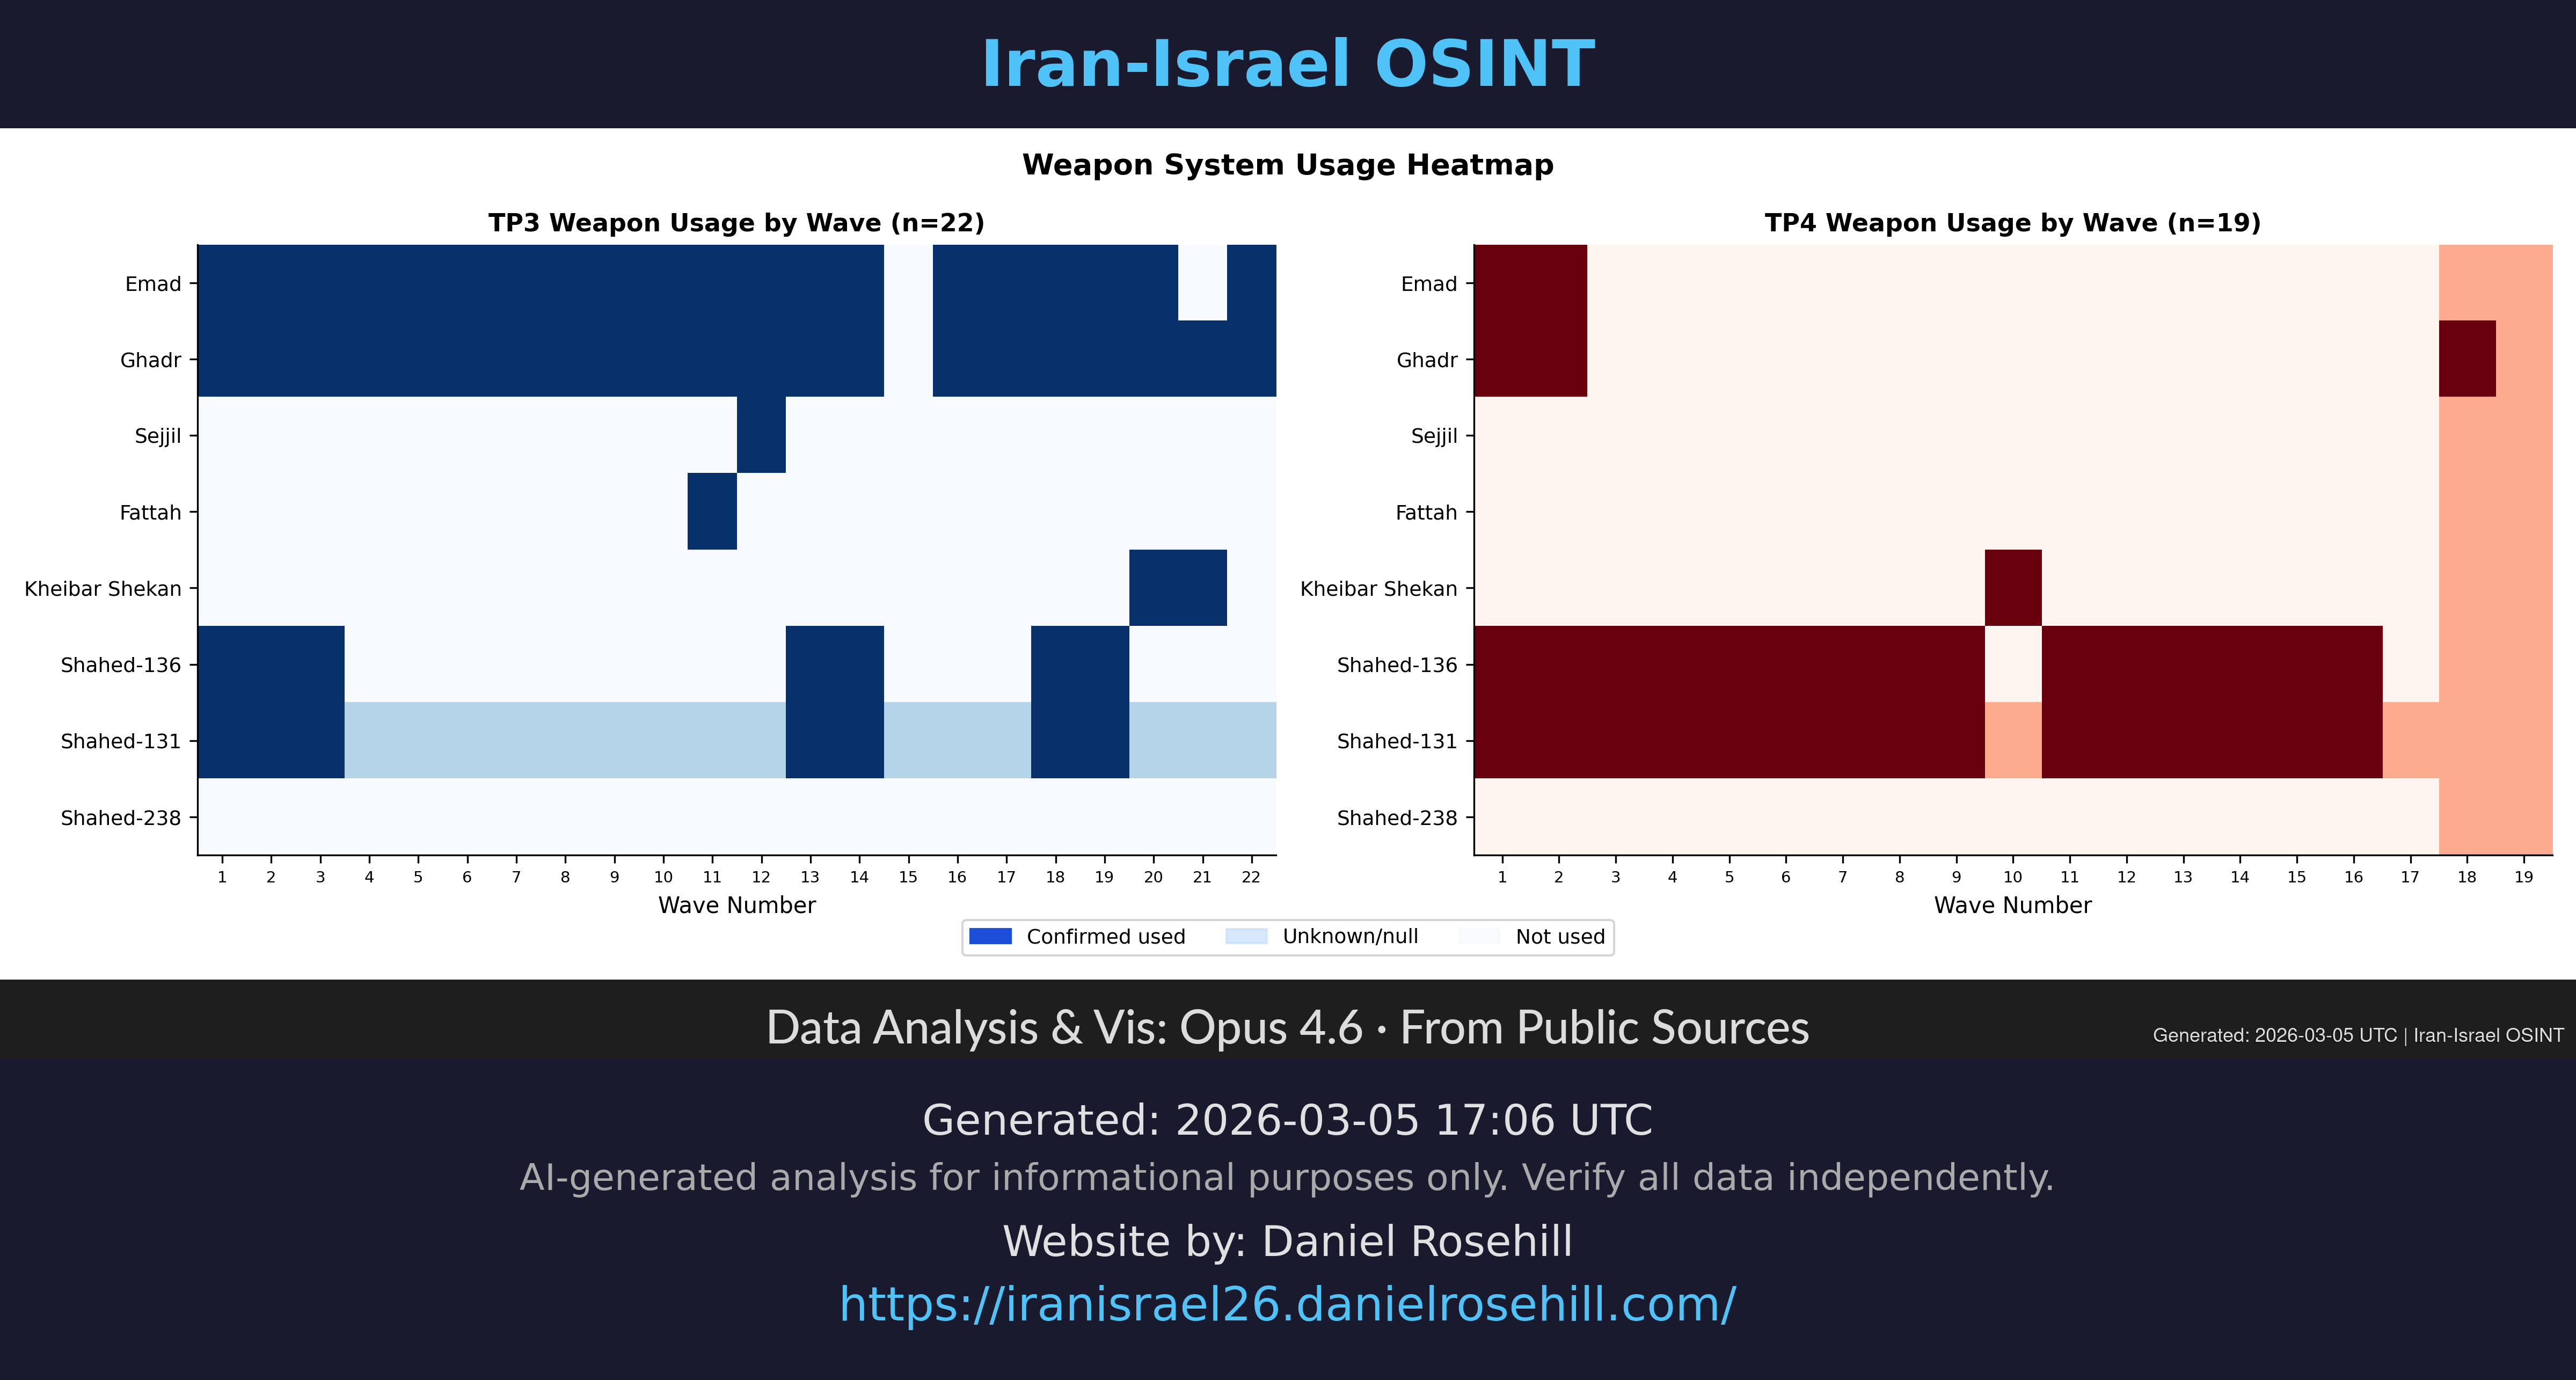
Weapon System Heatmap
Heatmap showing which Iranian weapon systems were used in each wave across TP3 and TP4.
Weapons Generated: 2026-03-05 UTC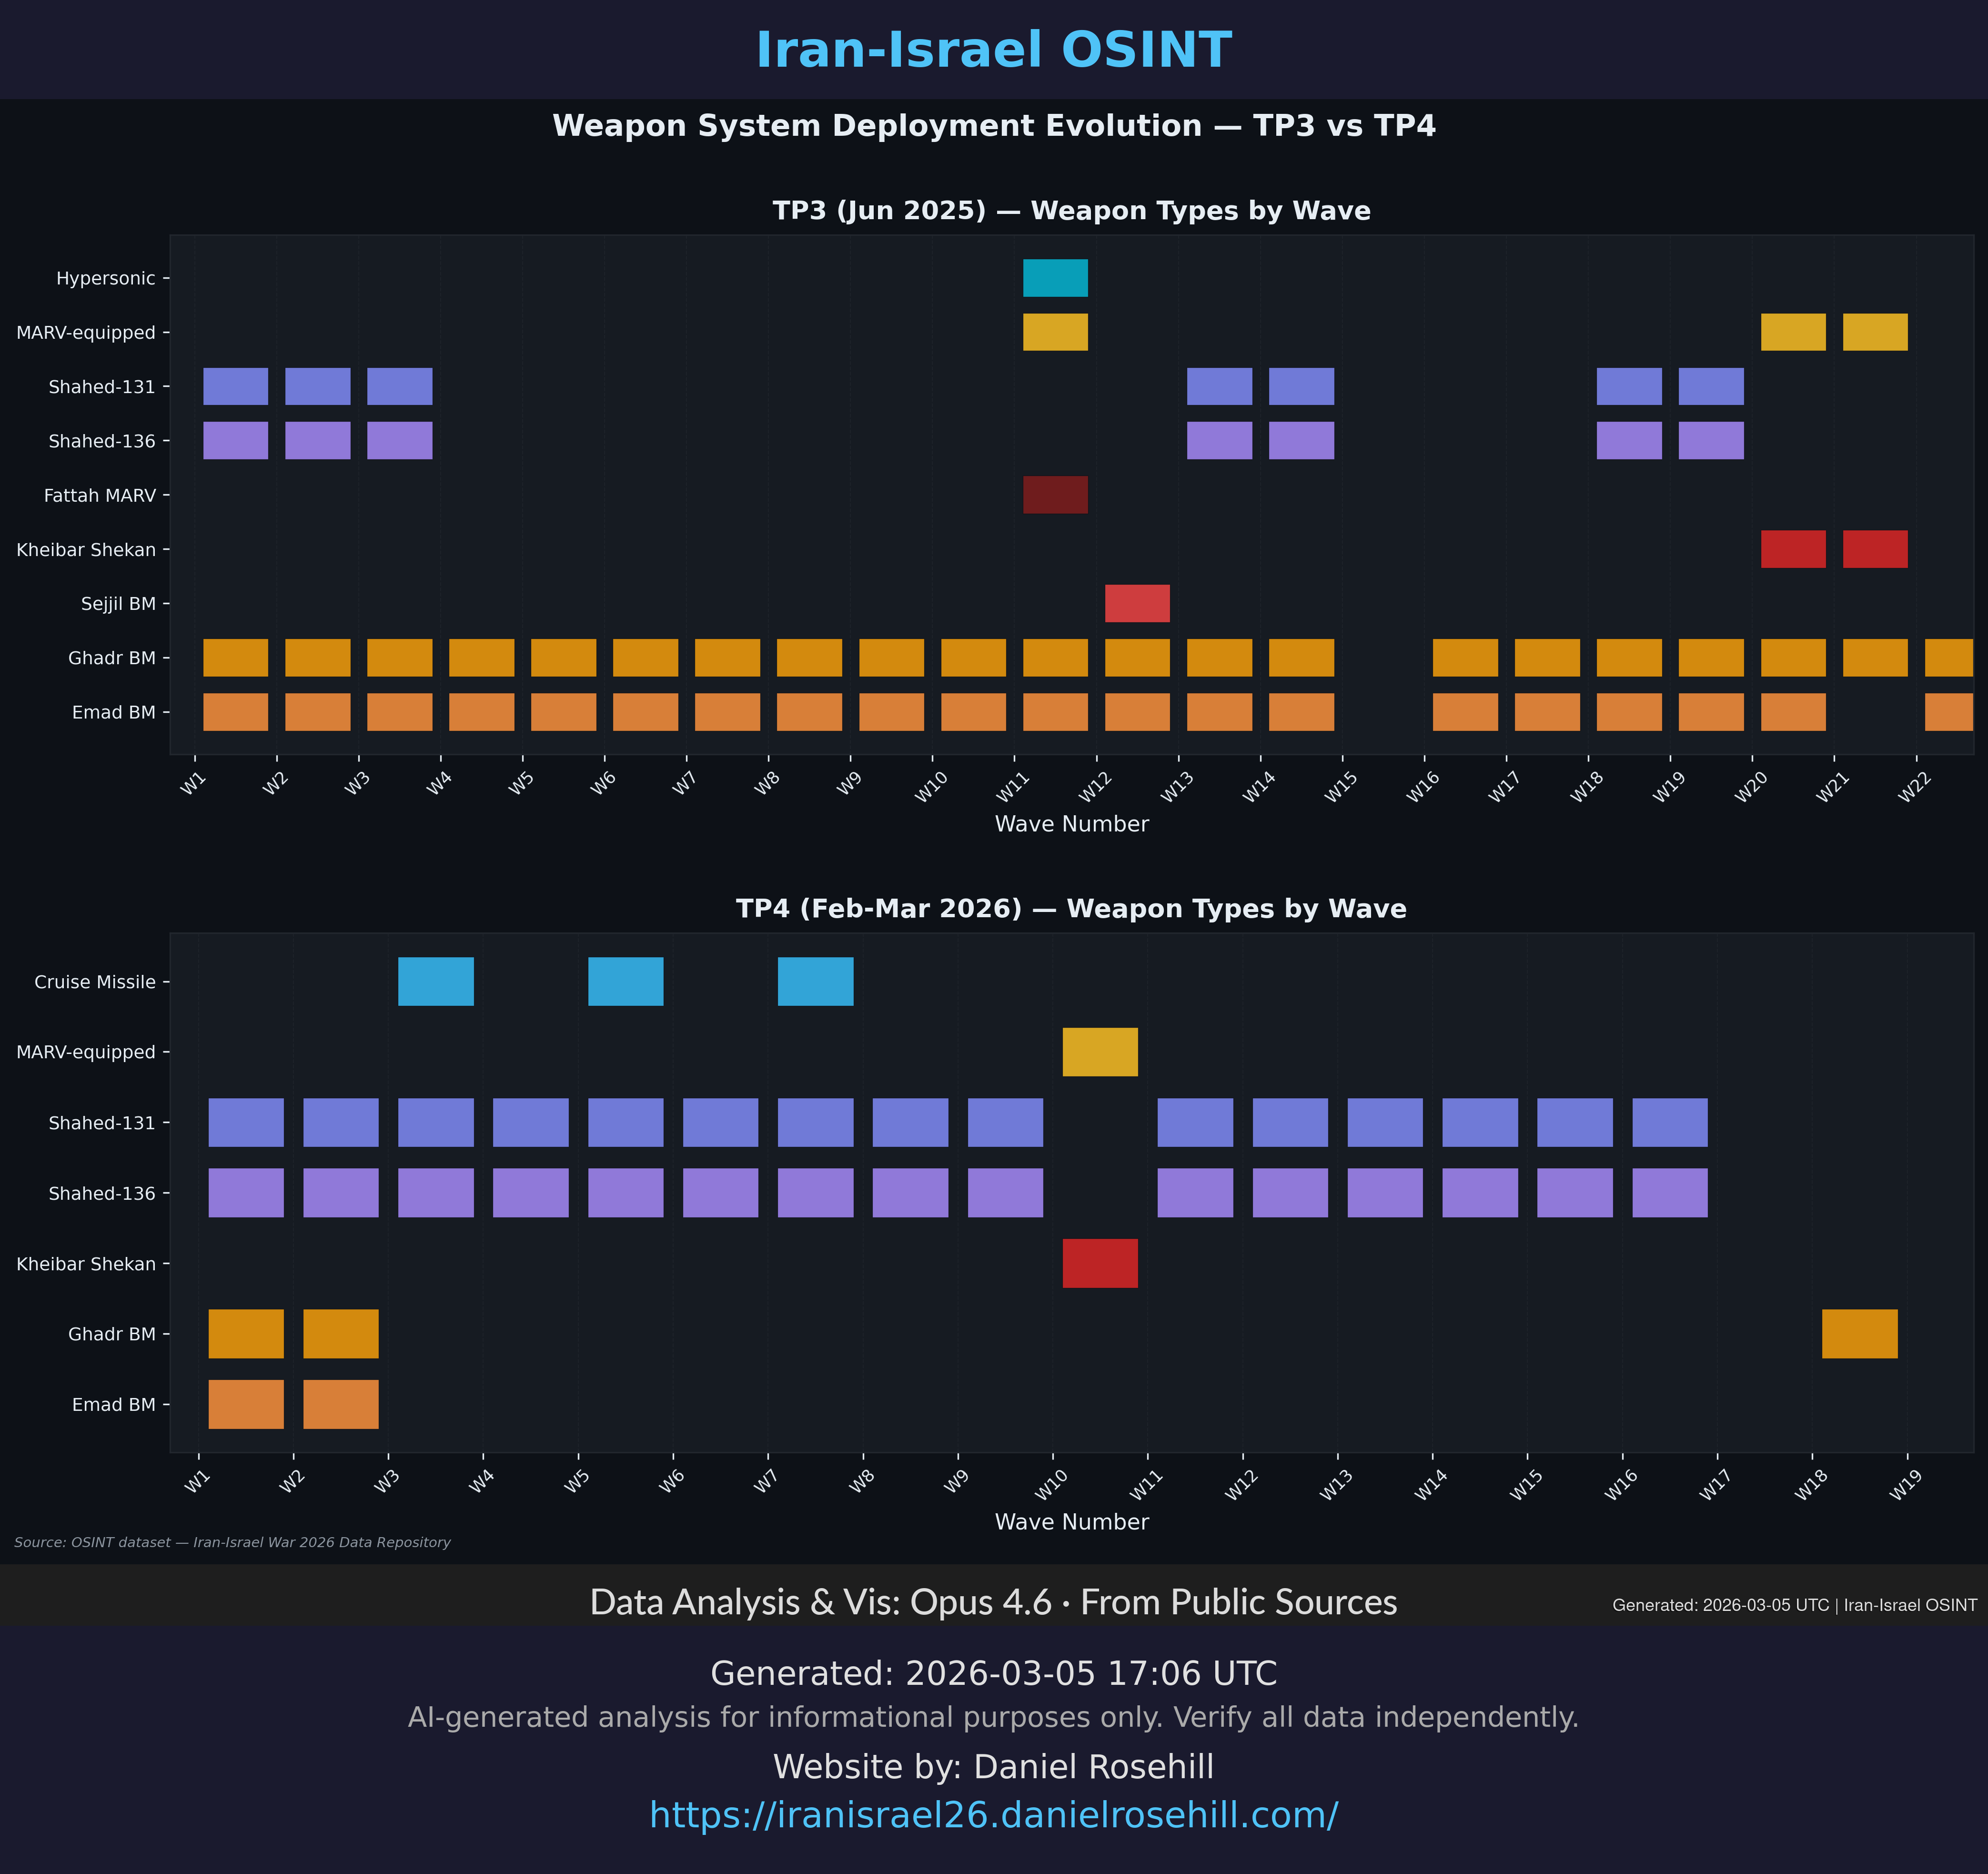
Weapon Mix Evolution
How Iran's weapon mix has changed across waves — from mixed salvos to specialized strikes.
Weapons Generated: 2026-03-05 UTC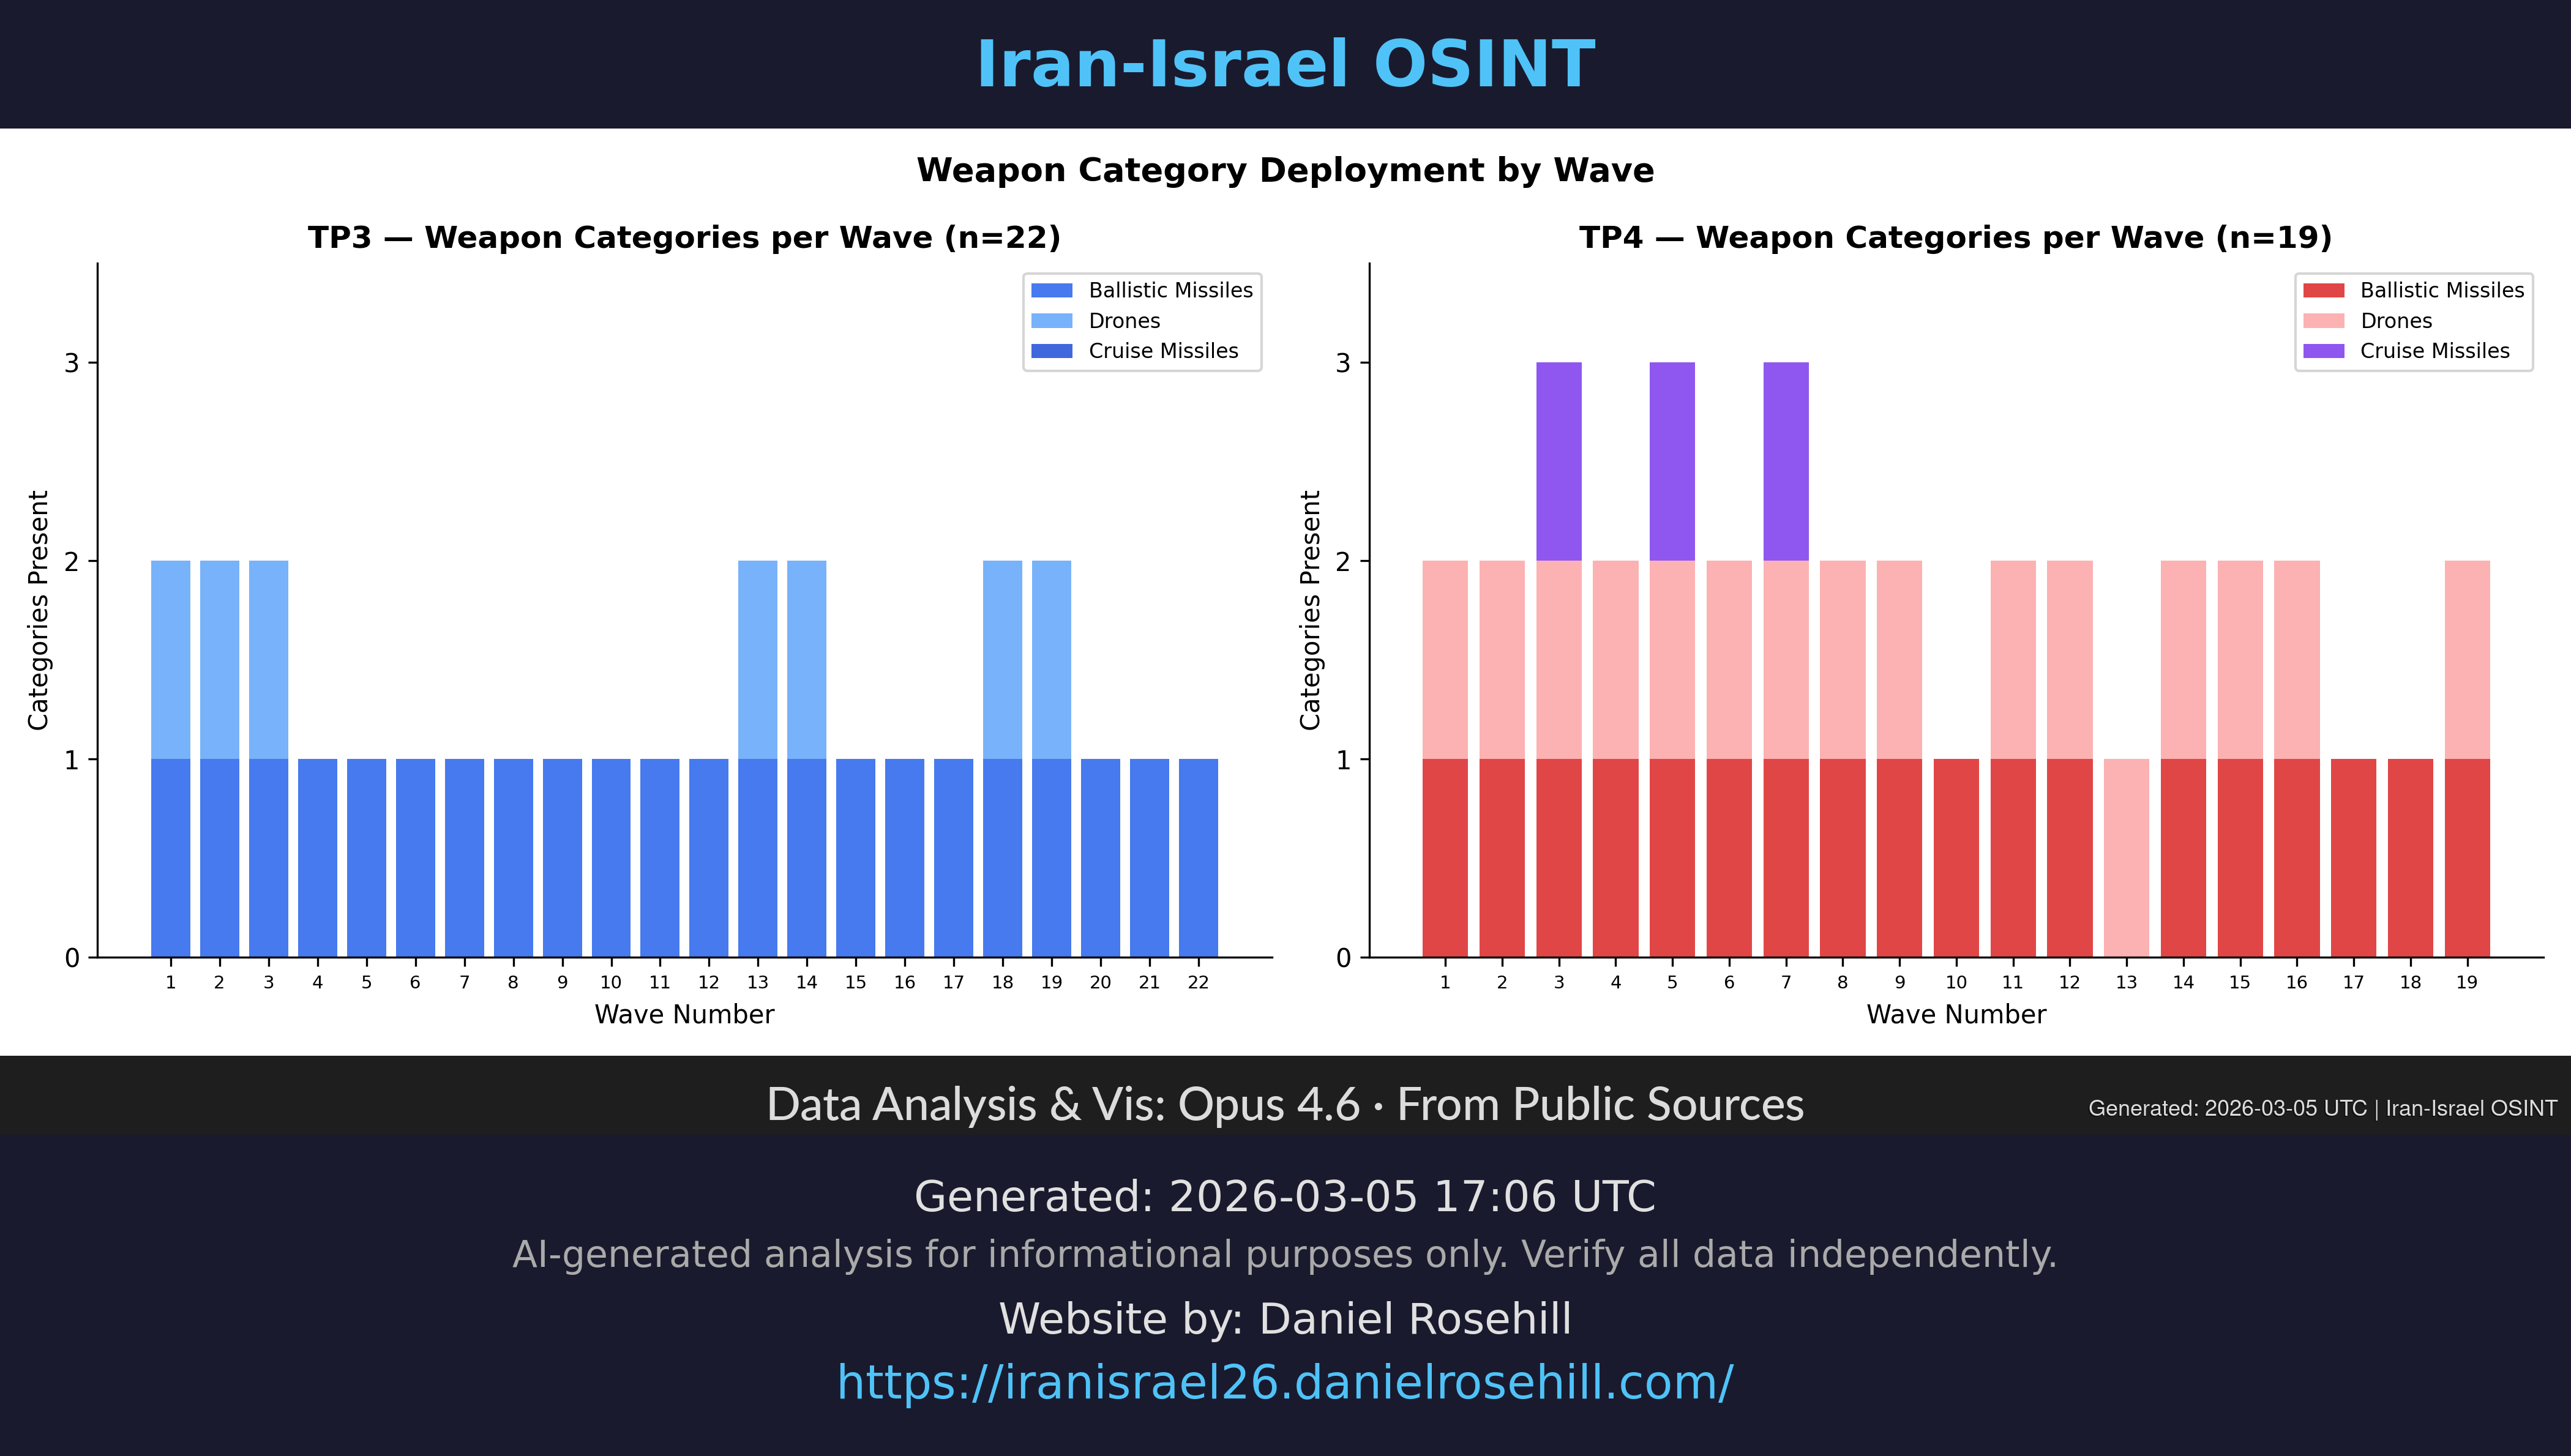
TP3 vs TP4 Weapon Mix
Side-by-side comparison of ballistic missile, cruise missile, and drone usage between operations.
Weapons Generated: 2026-03-05 UTC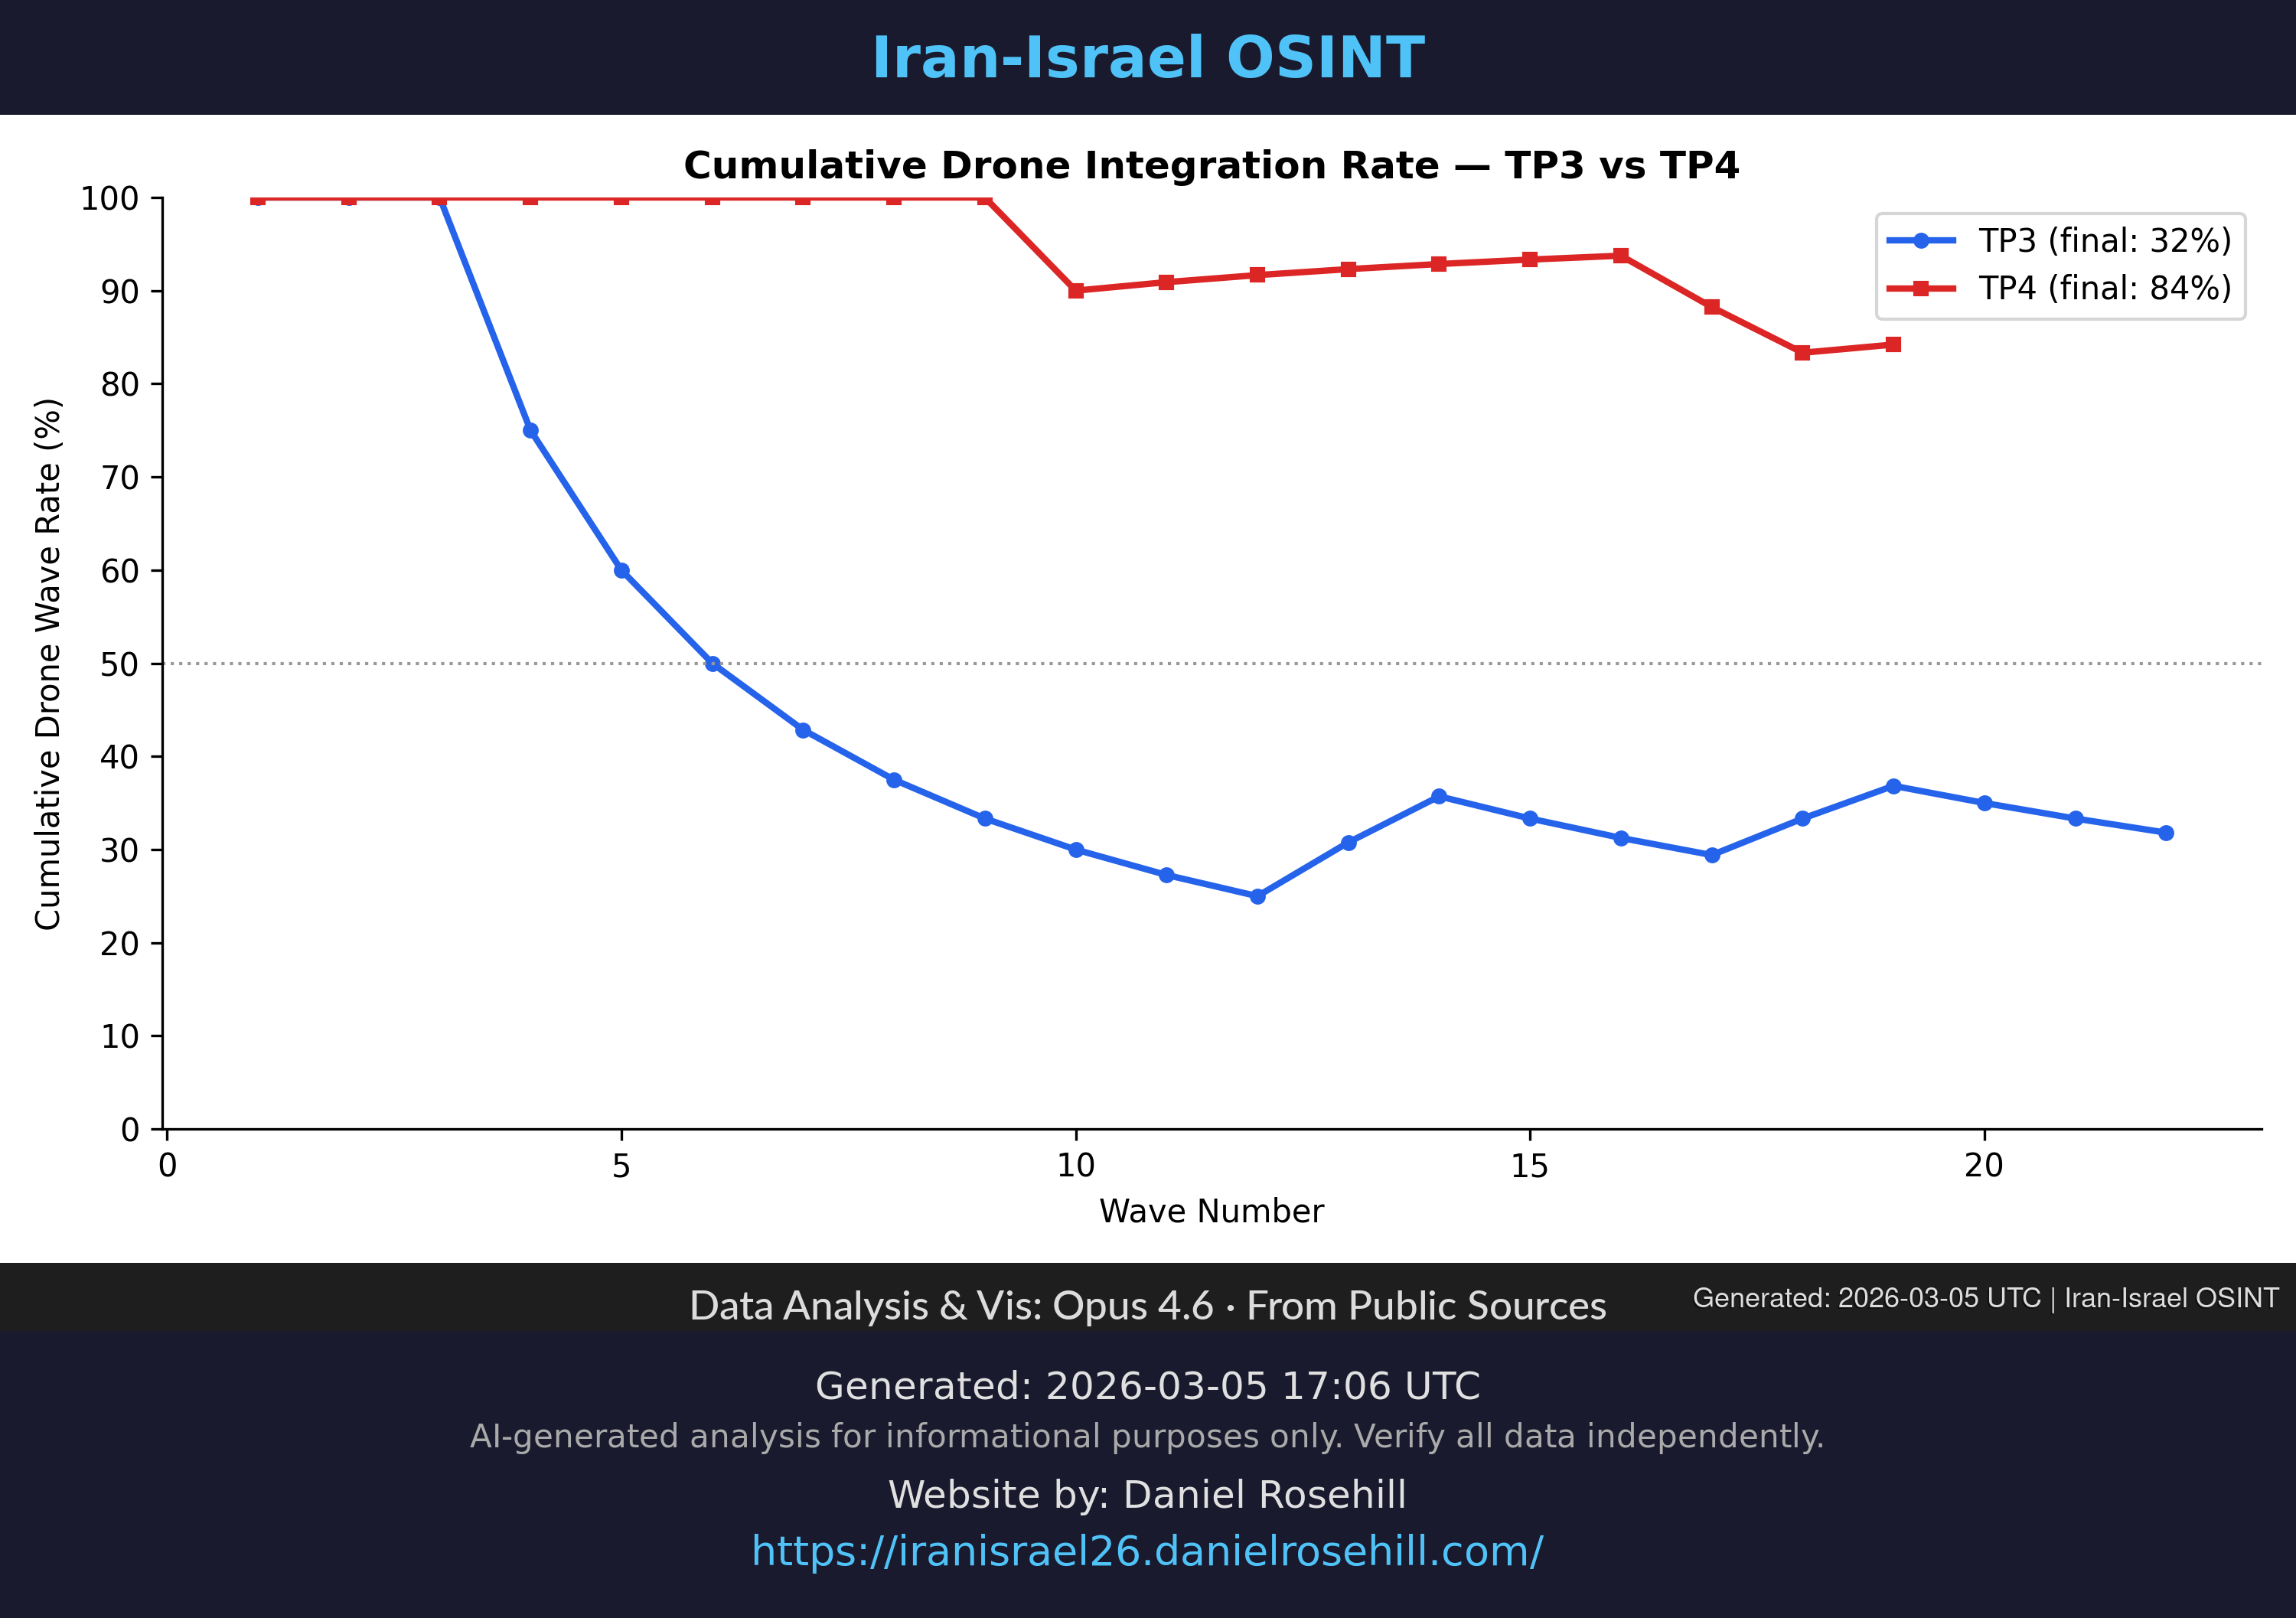
Drone Ratio Analysis
Proportion of drone vs. missile usage and how it has shifted between operations.
Weapons Generated: 2026-03-05 UTC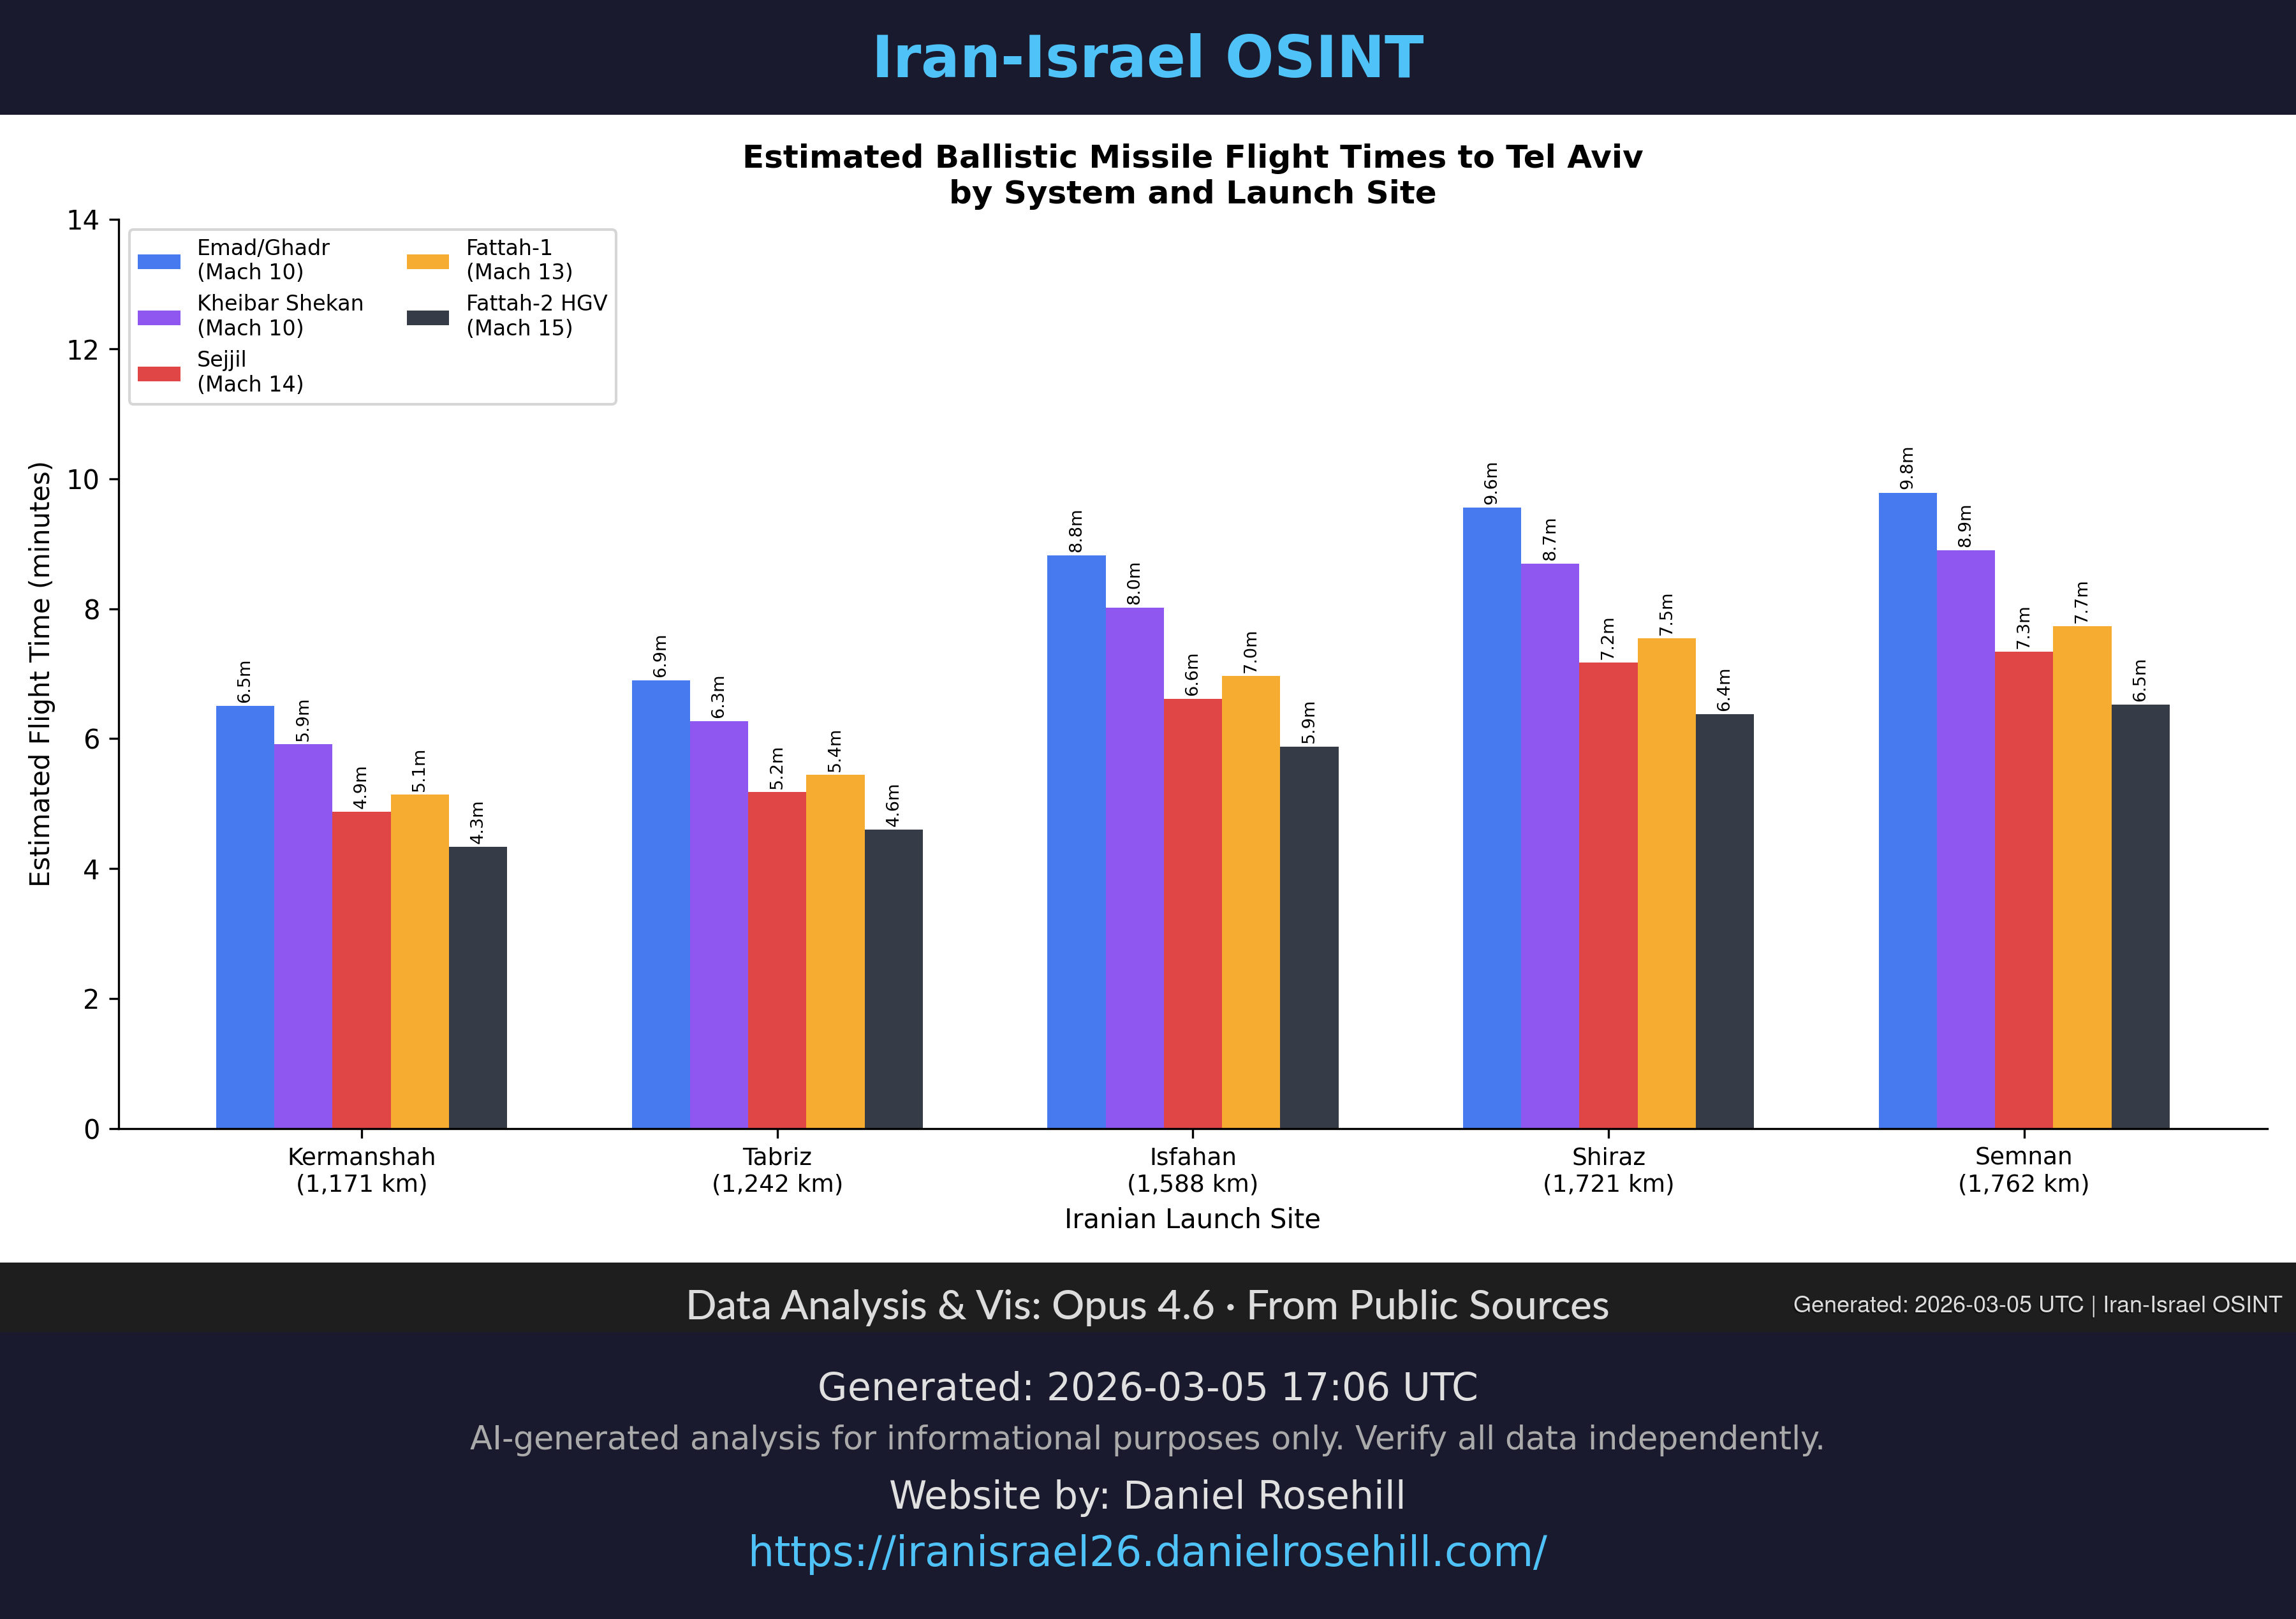
Estimated Flight Times
Comparative flight times for different weapon systems from Iranian launch sites to targets.
Weapons Generated: 2026-03-05 UTC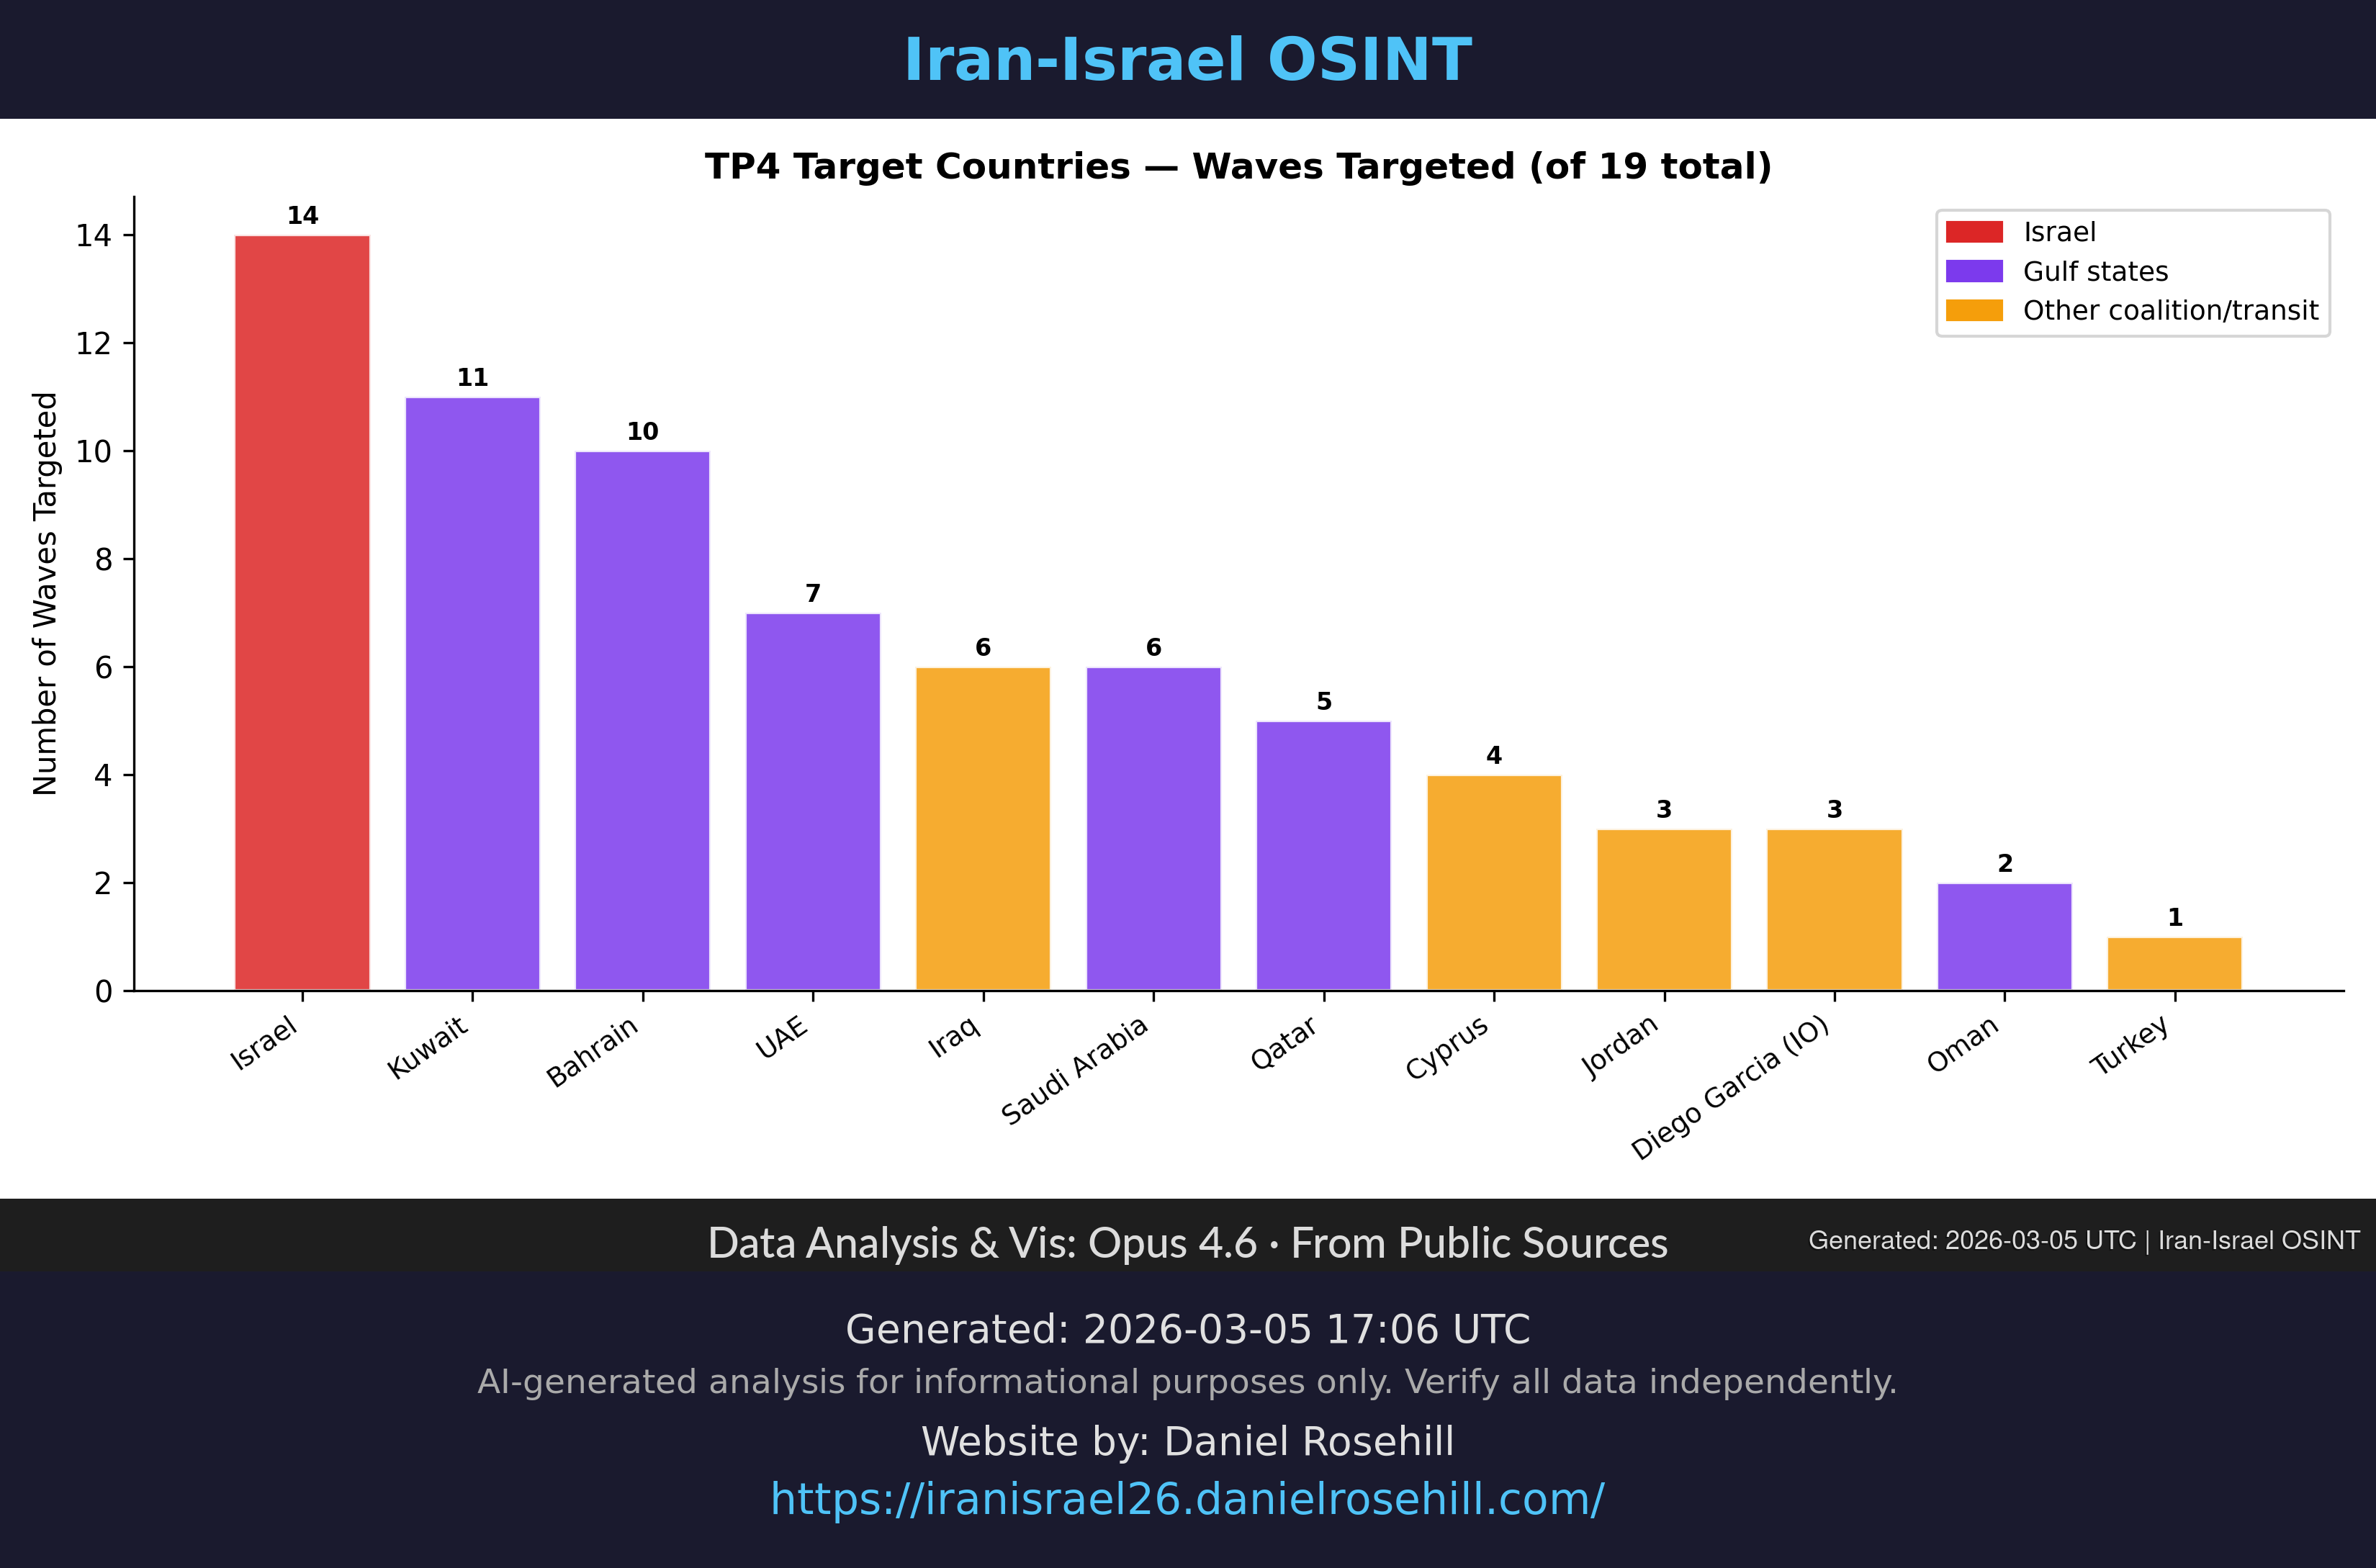
Target Geography
Geographic distribution of targets across TP4 — spanning 12 countries from the Mediterranean to the Indian Ocean.
Targets Generated: 2026-03-05 UTC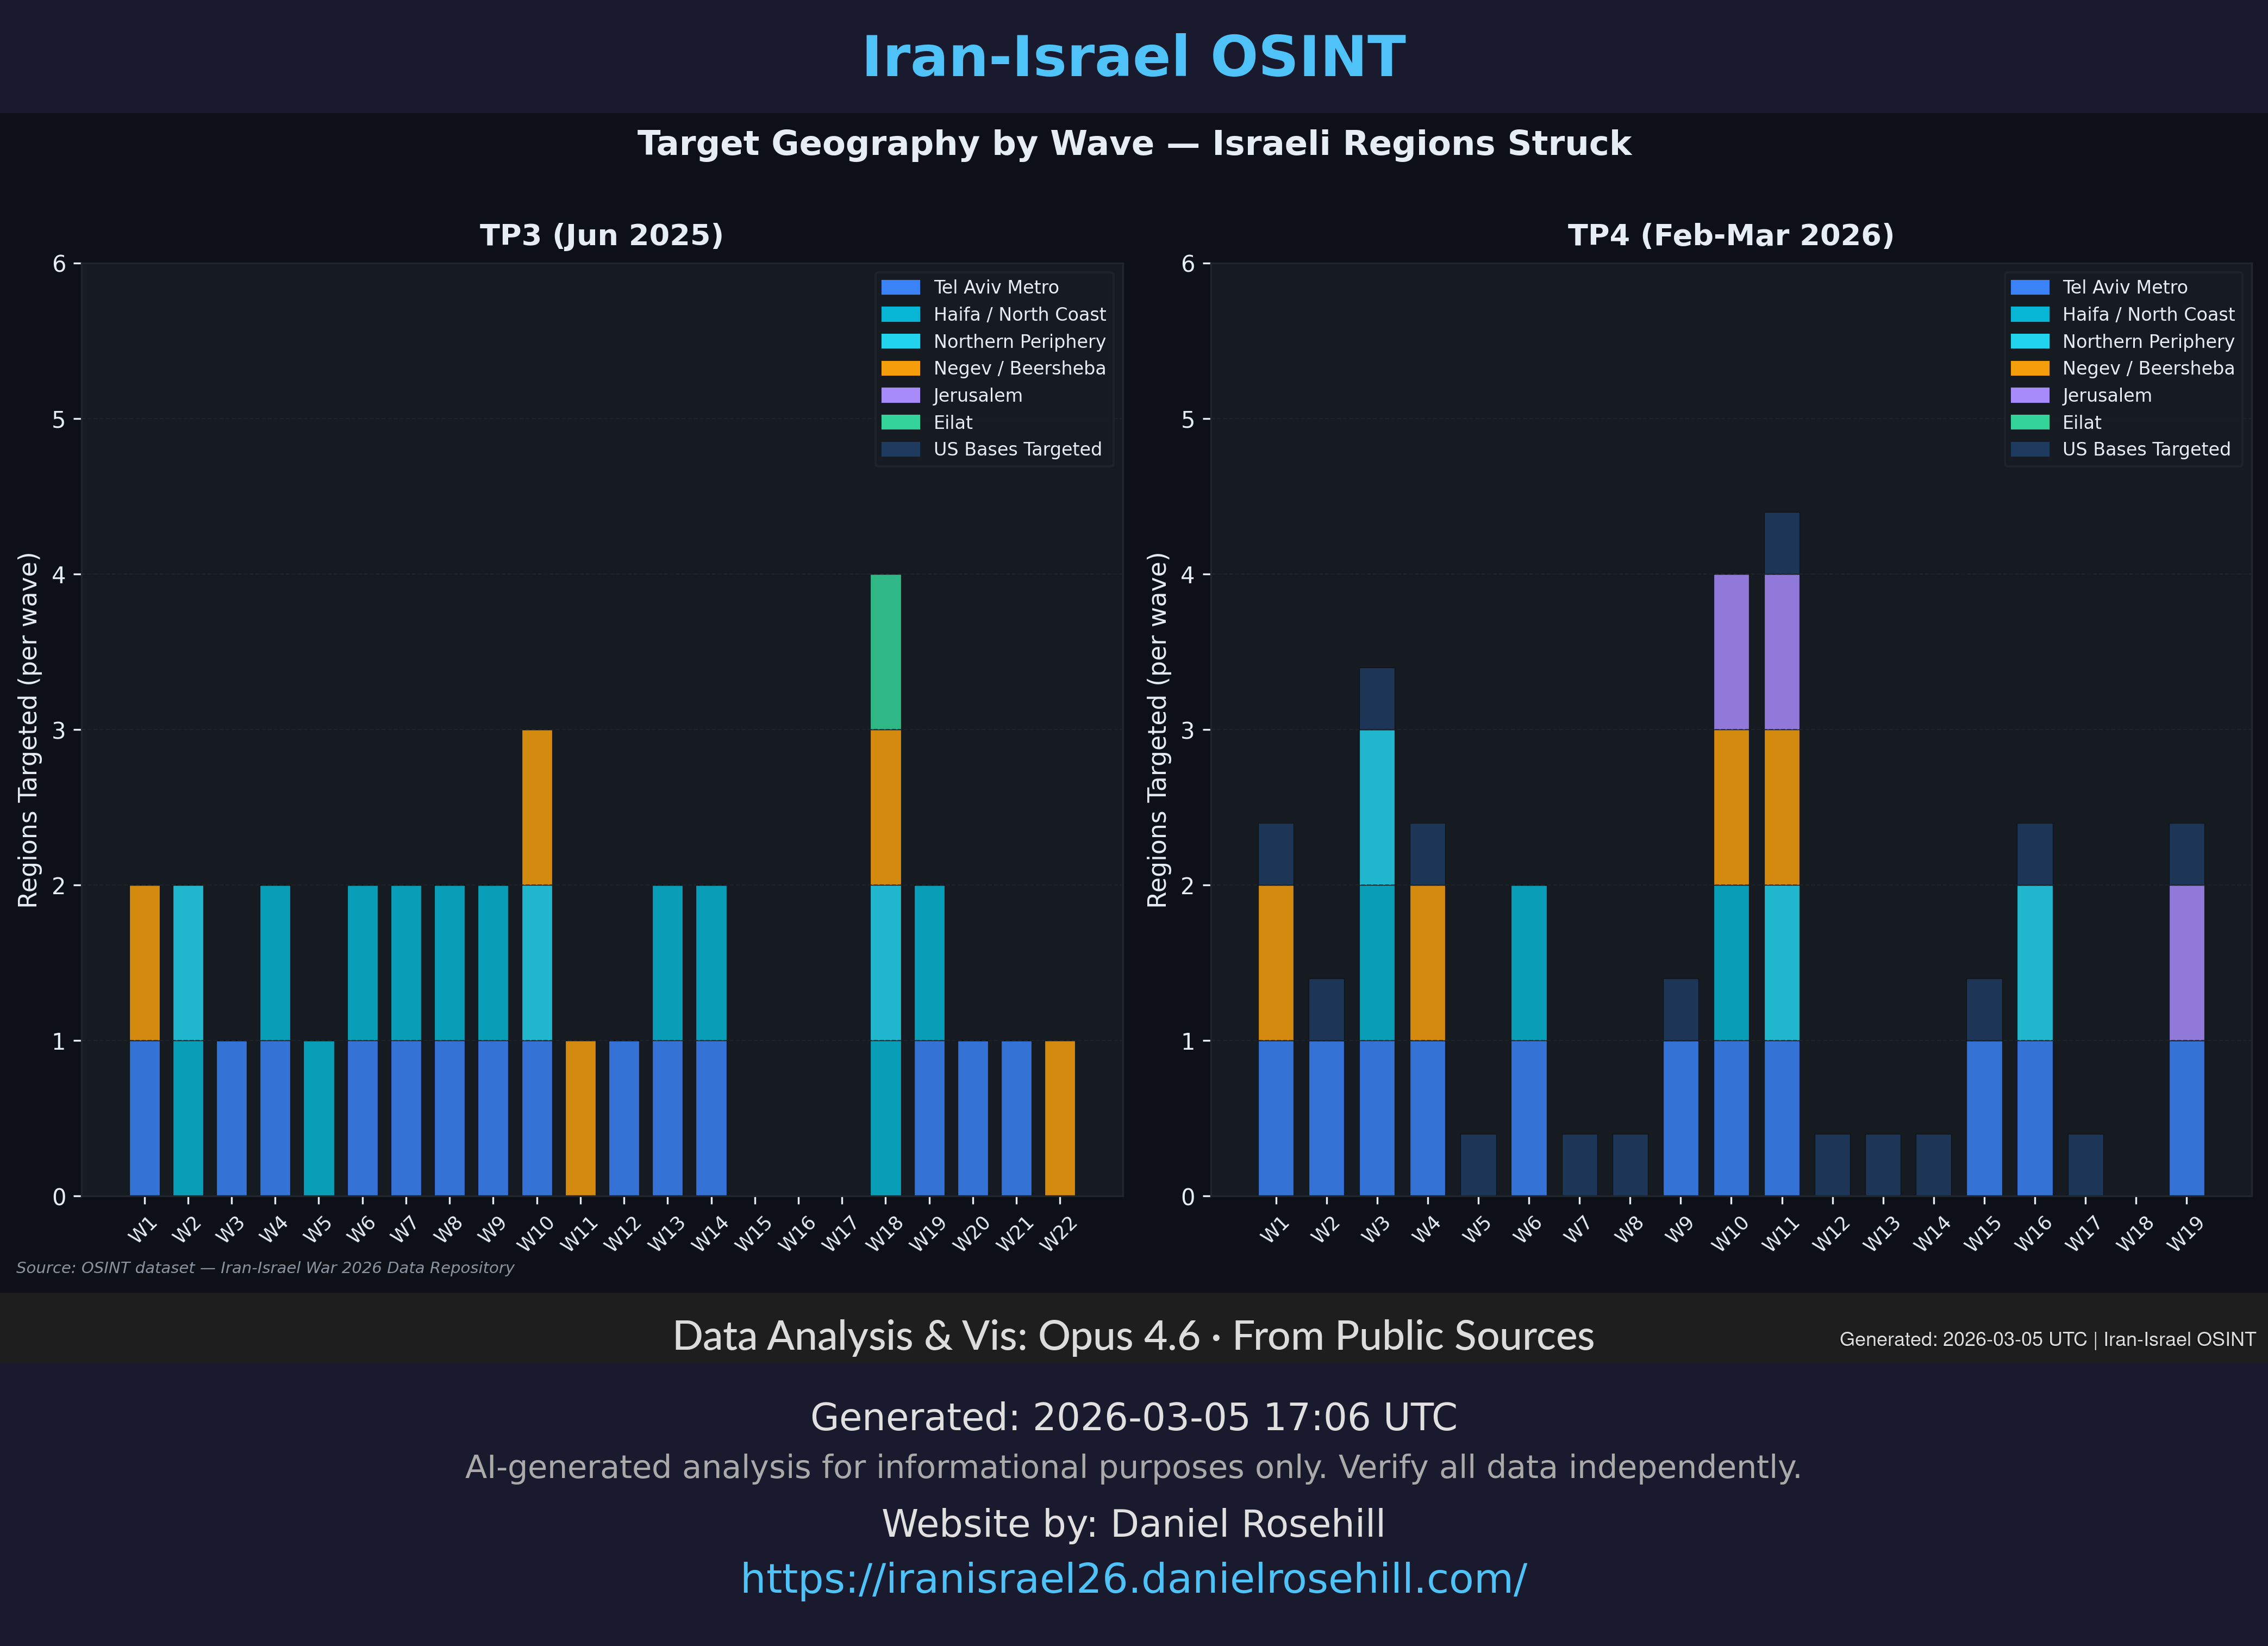
Country-Level Targeting
Which countries were targeted and how frequently across all waves.
Targets Generated: 2026-03-05 UTC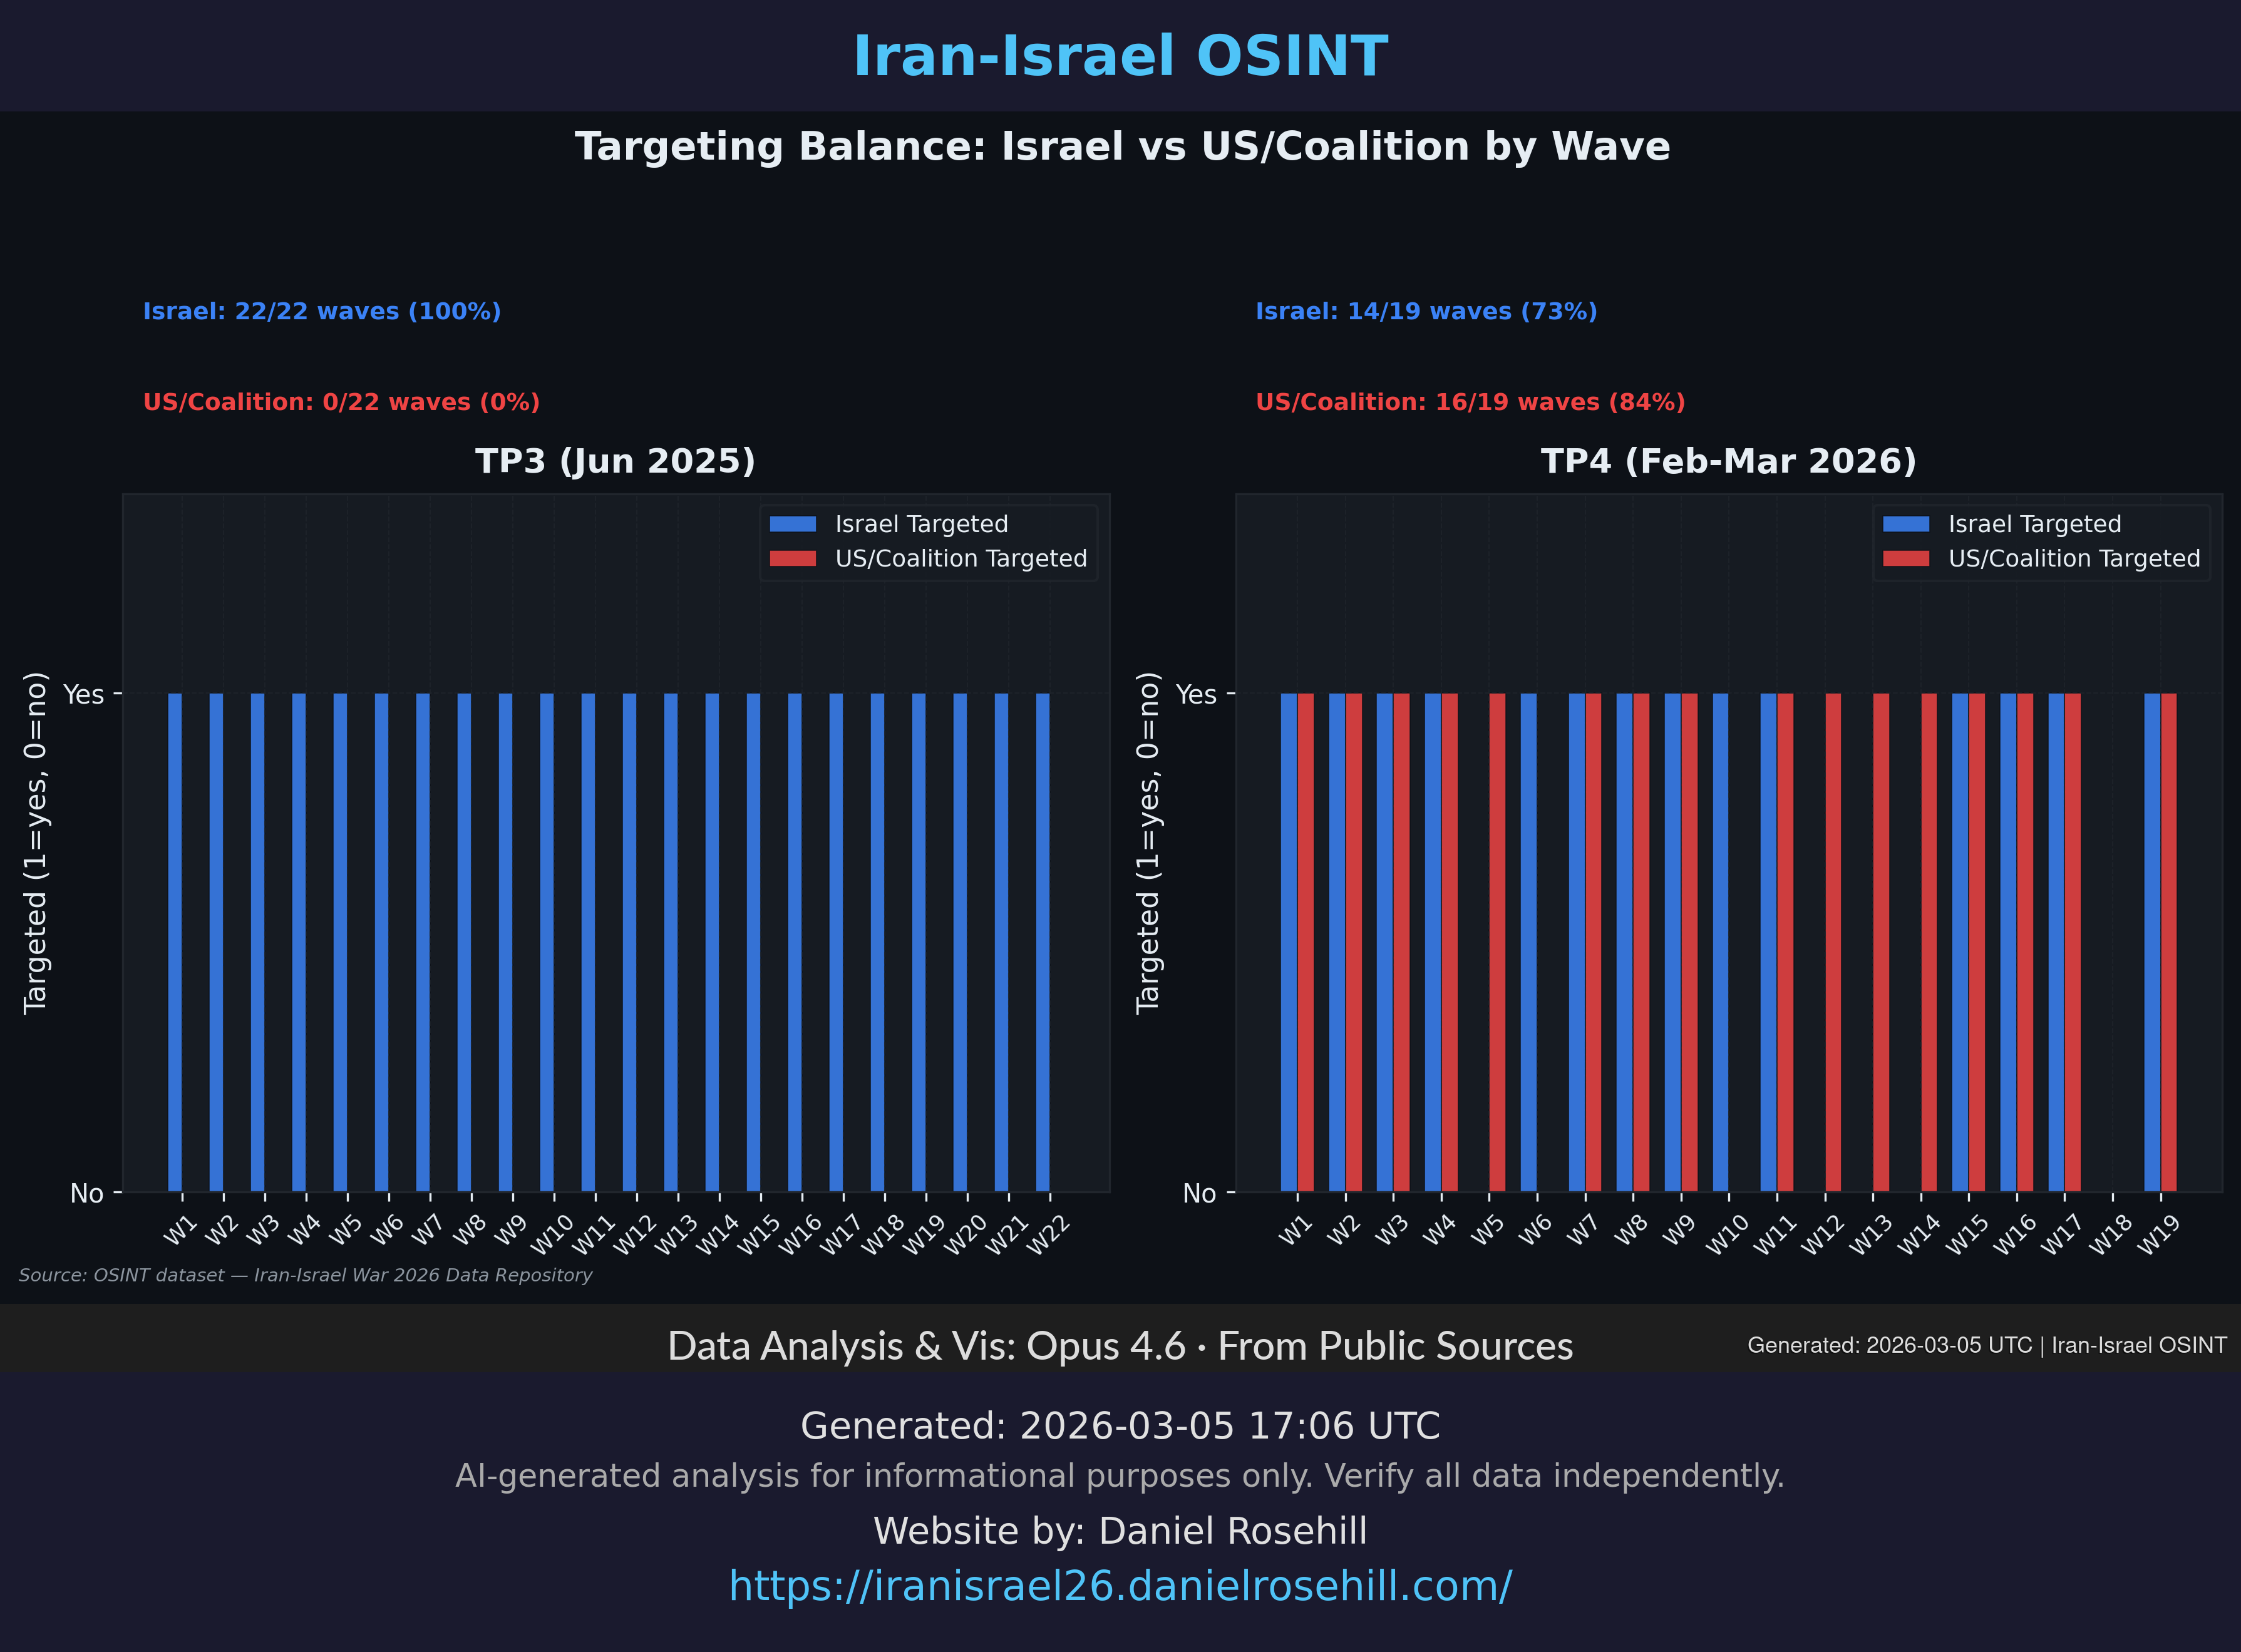
Israel vs US Base Targeting
Balance between Israeli targets and US/coalition base targets per wave — a key TP4 evolution.
Targets Generated: 2026-03-05 UTC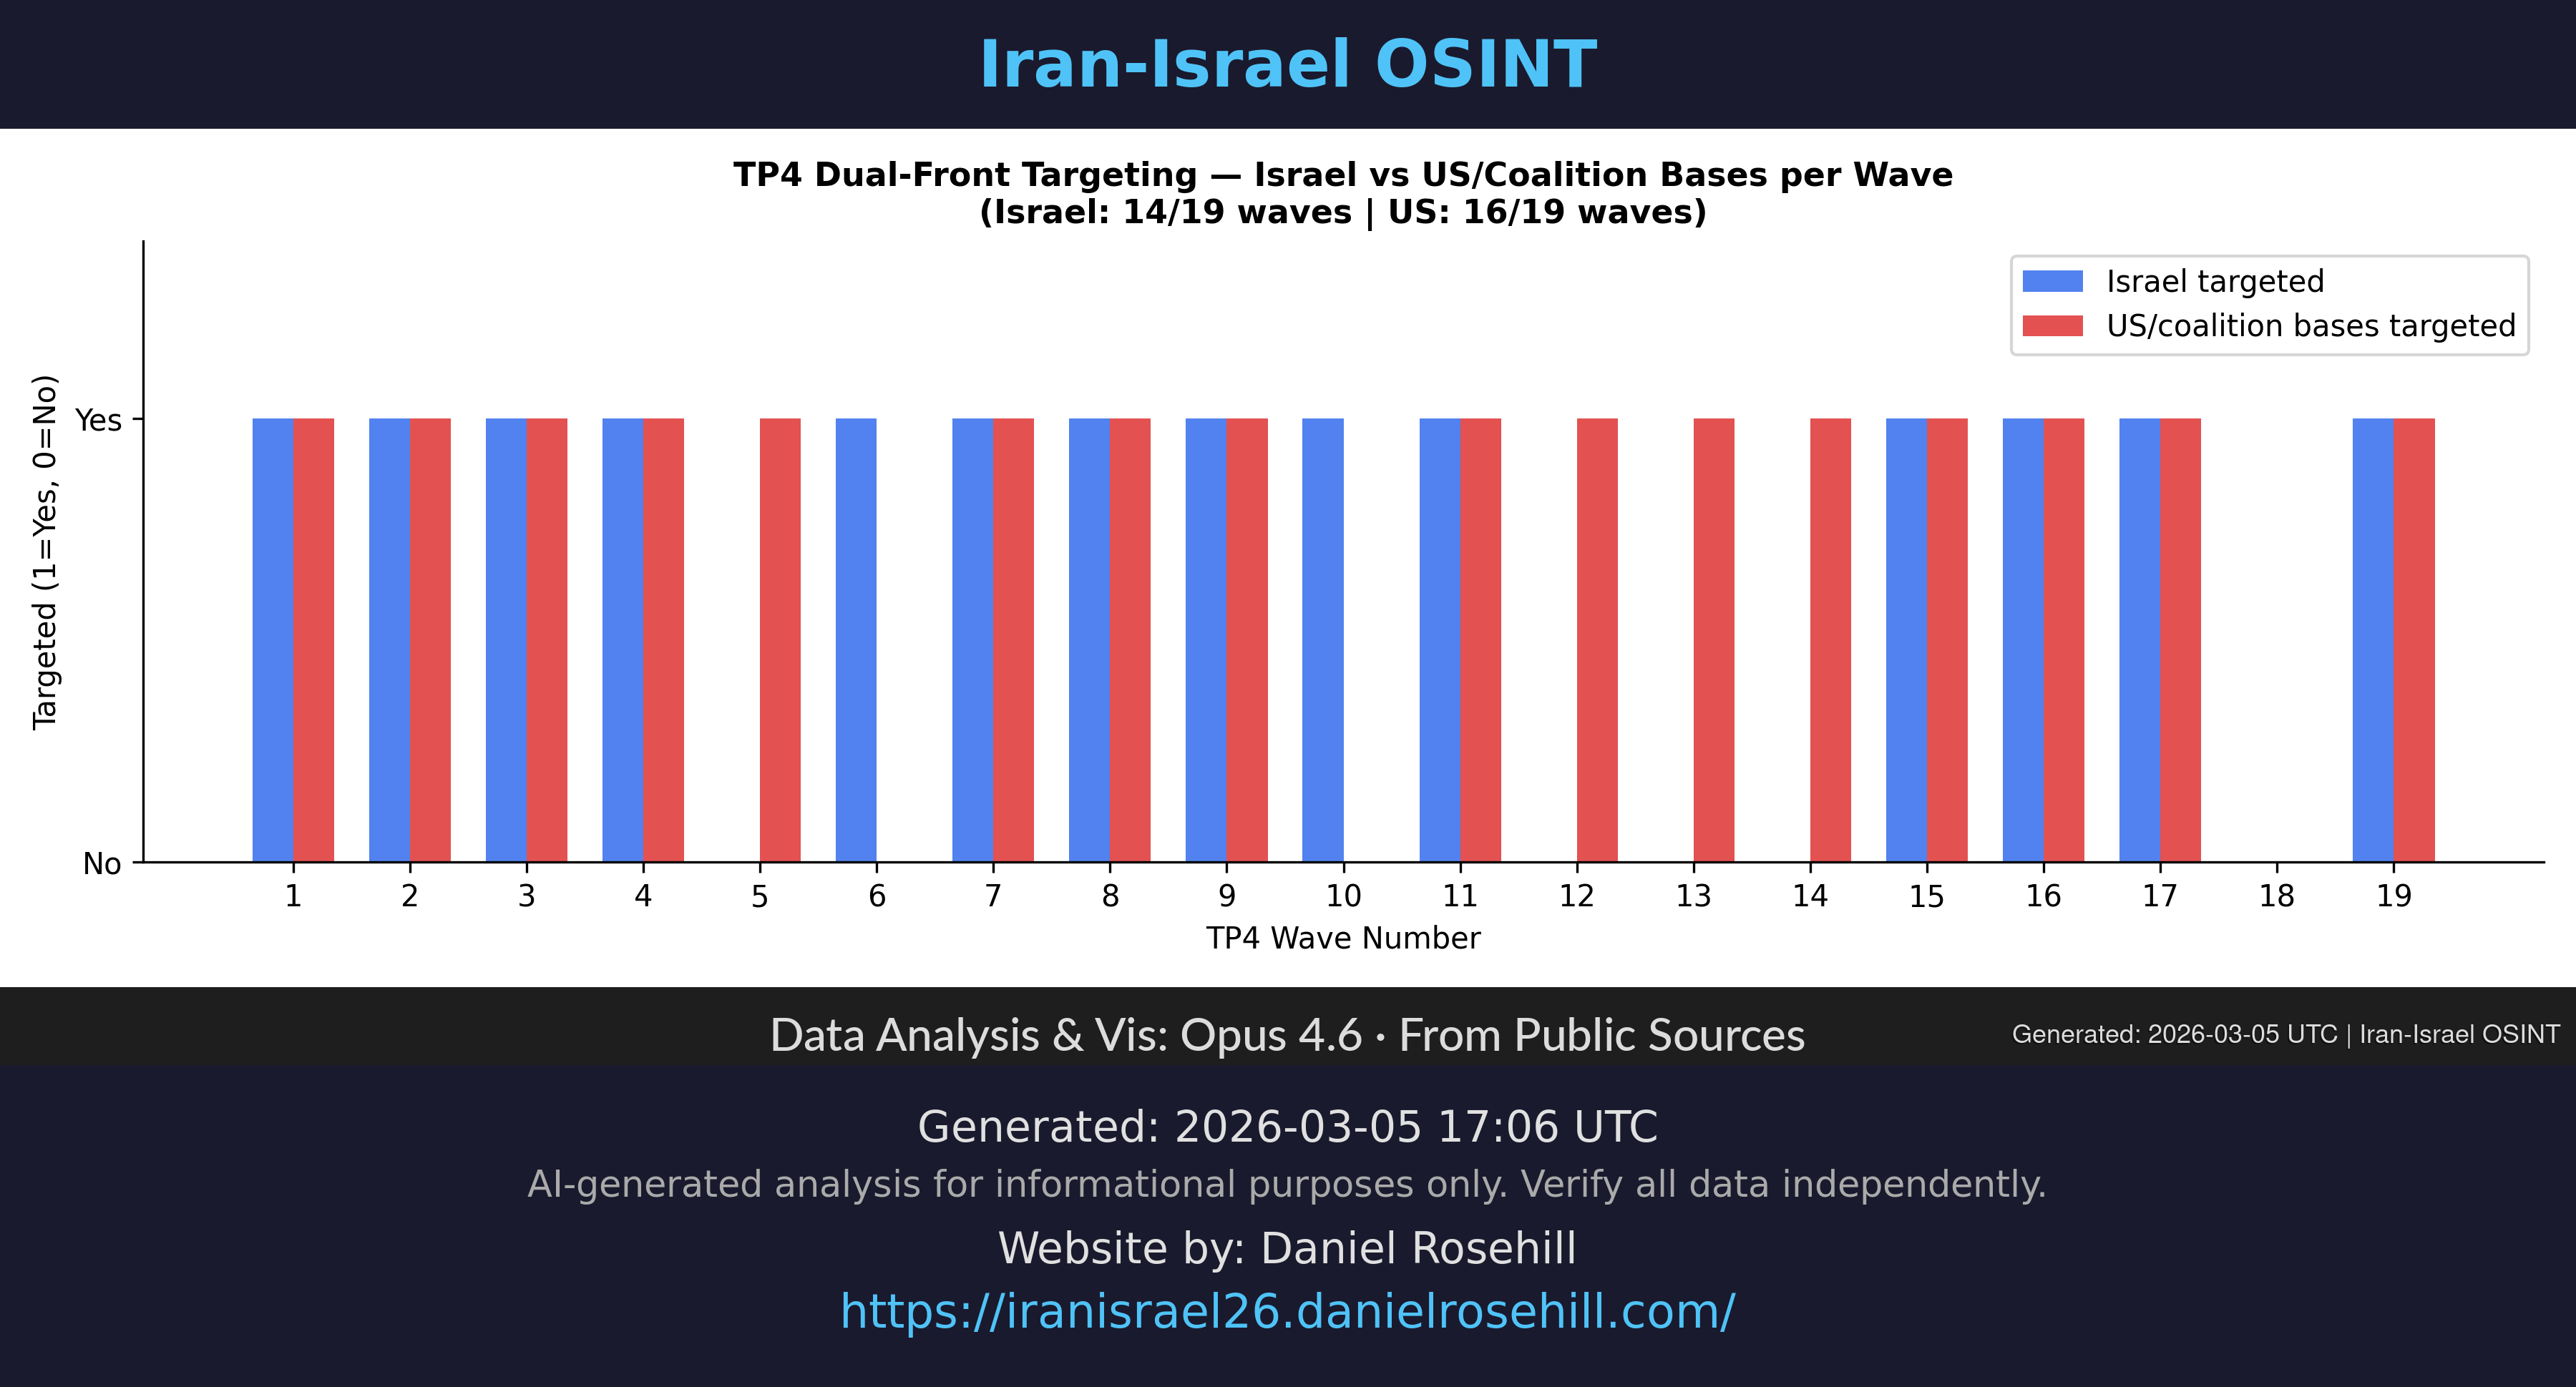
Dual-Front Operations
How TP4 expanded from Israel-only targeting to simultaneous dual-front operations against Israel and US/coalition.
Targets Generated: 2026-03-05 UTC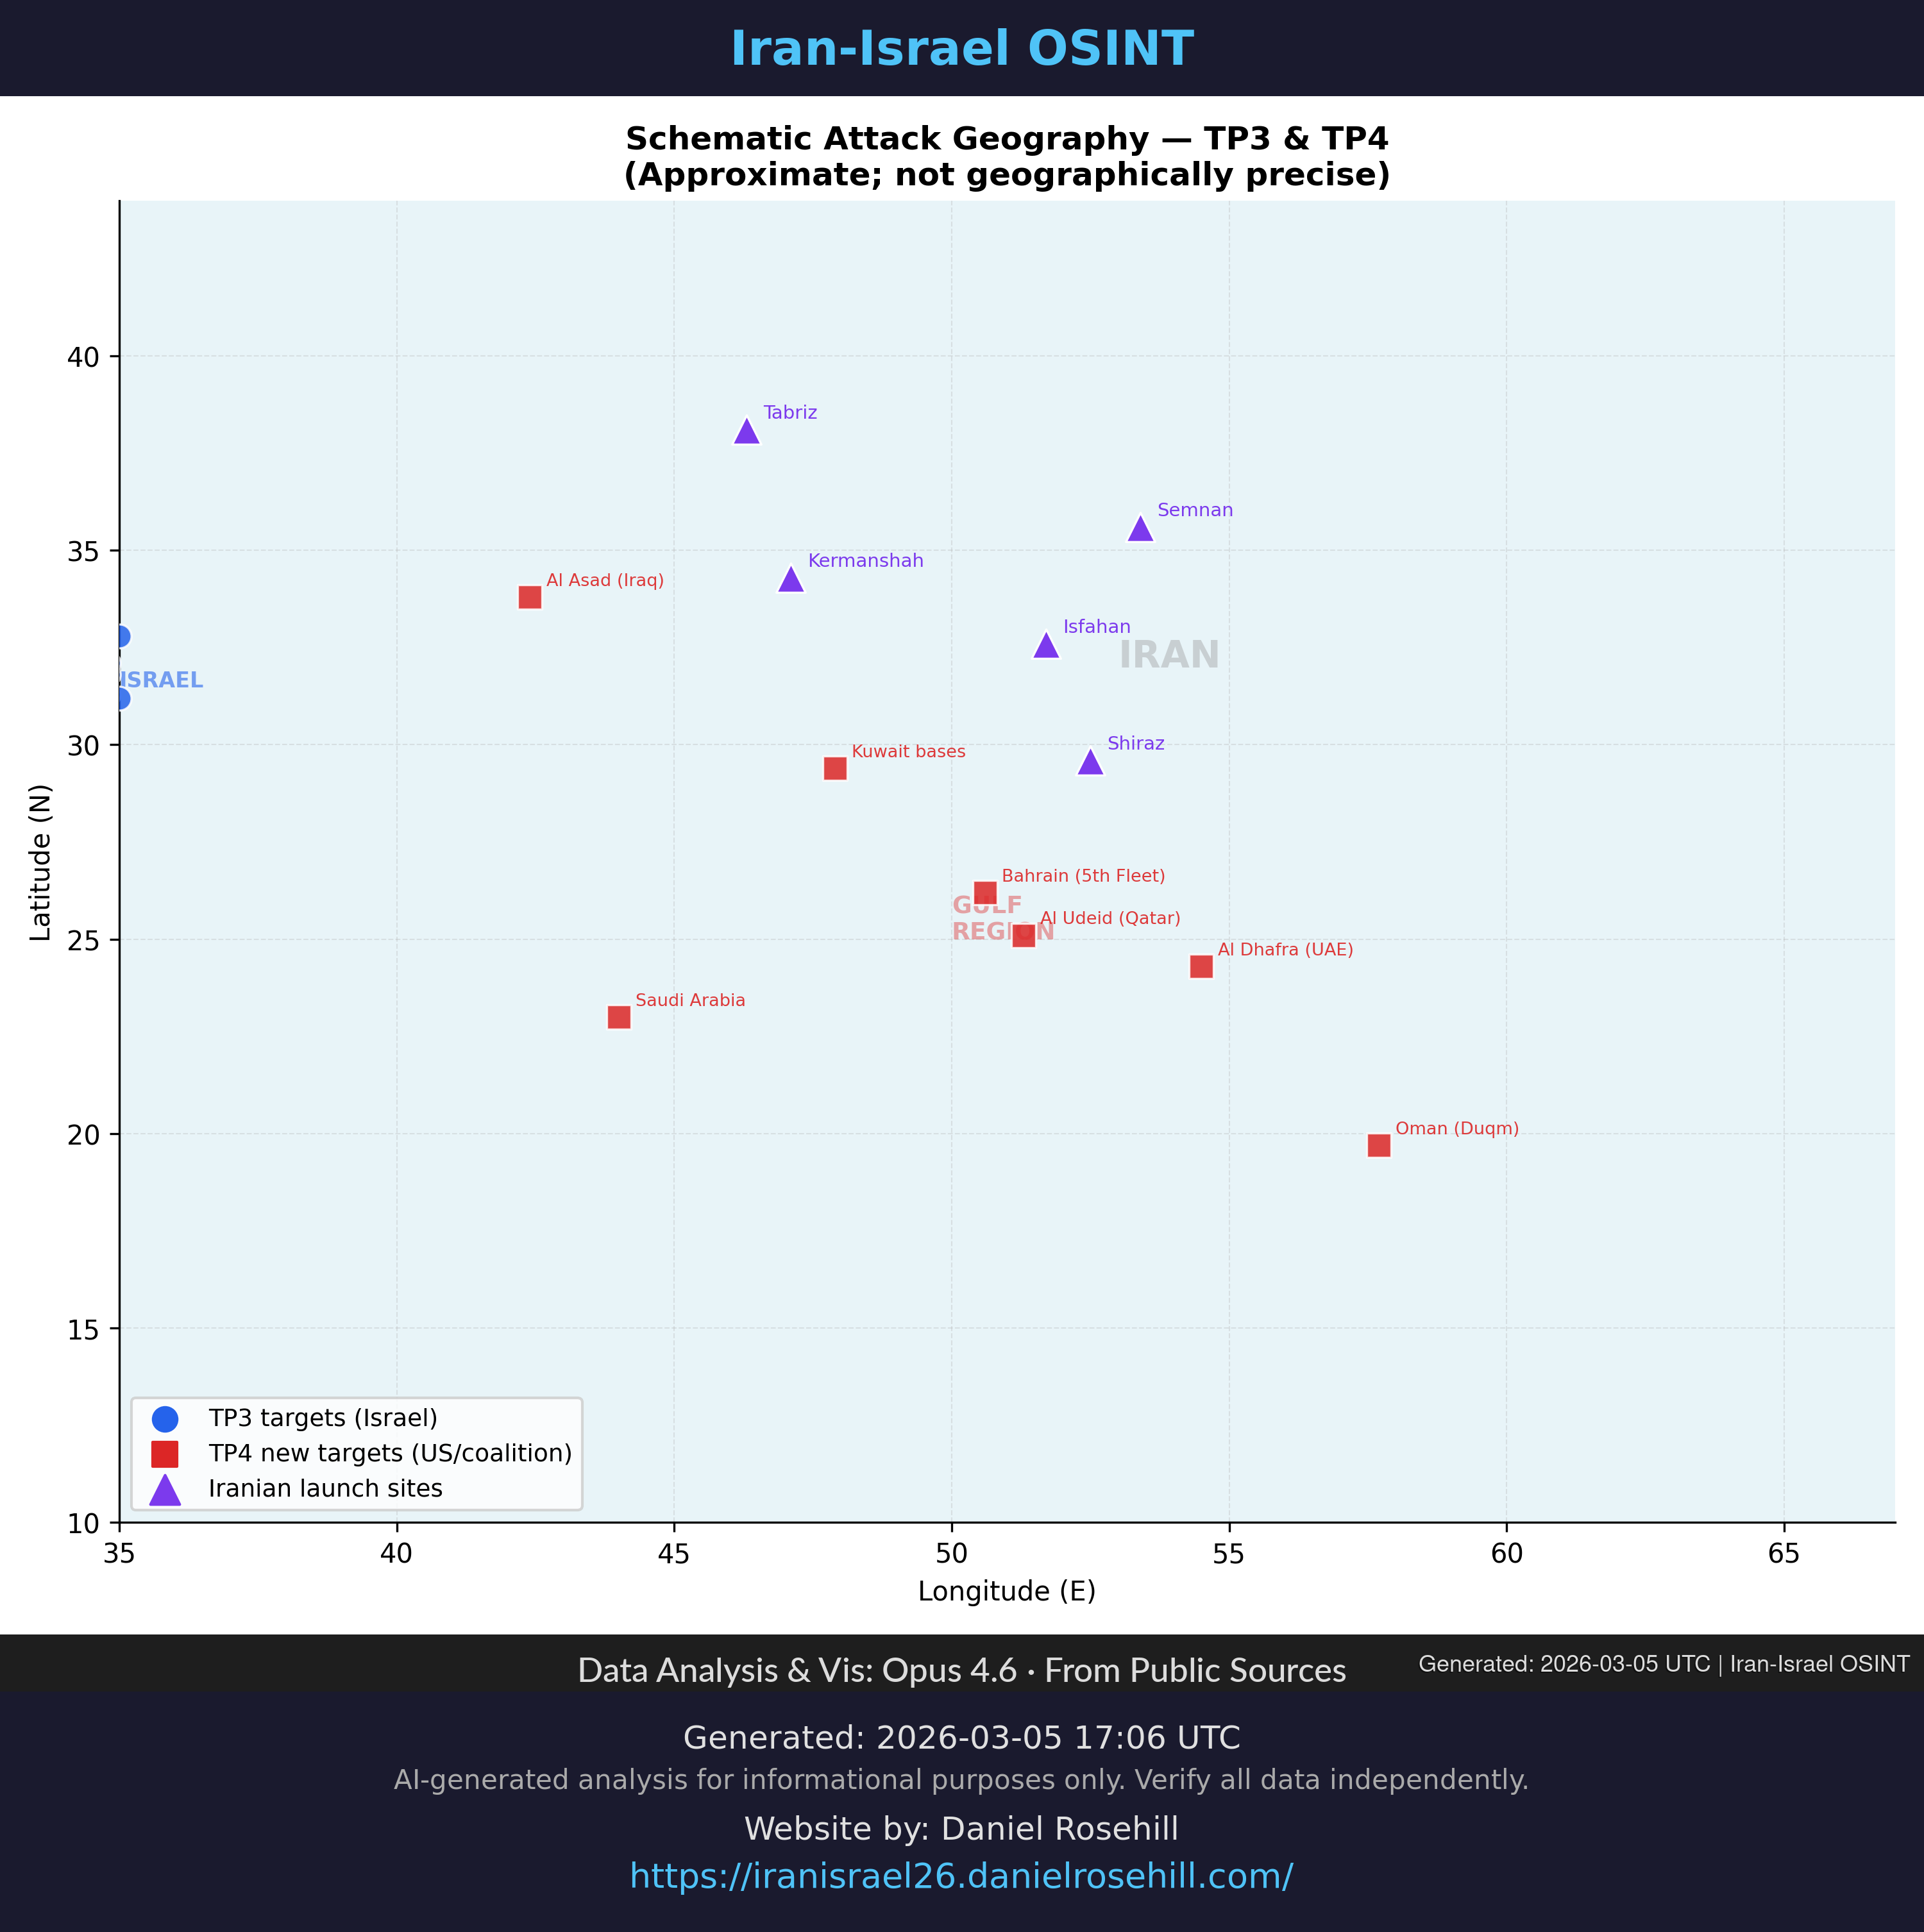
Theater Overview Map
Full theater map showing launch sites, targets, and the geographic scope of Iranian operations.
Targets Generated: 2026-03-05 UTC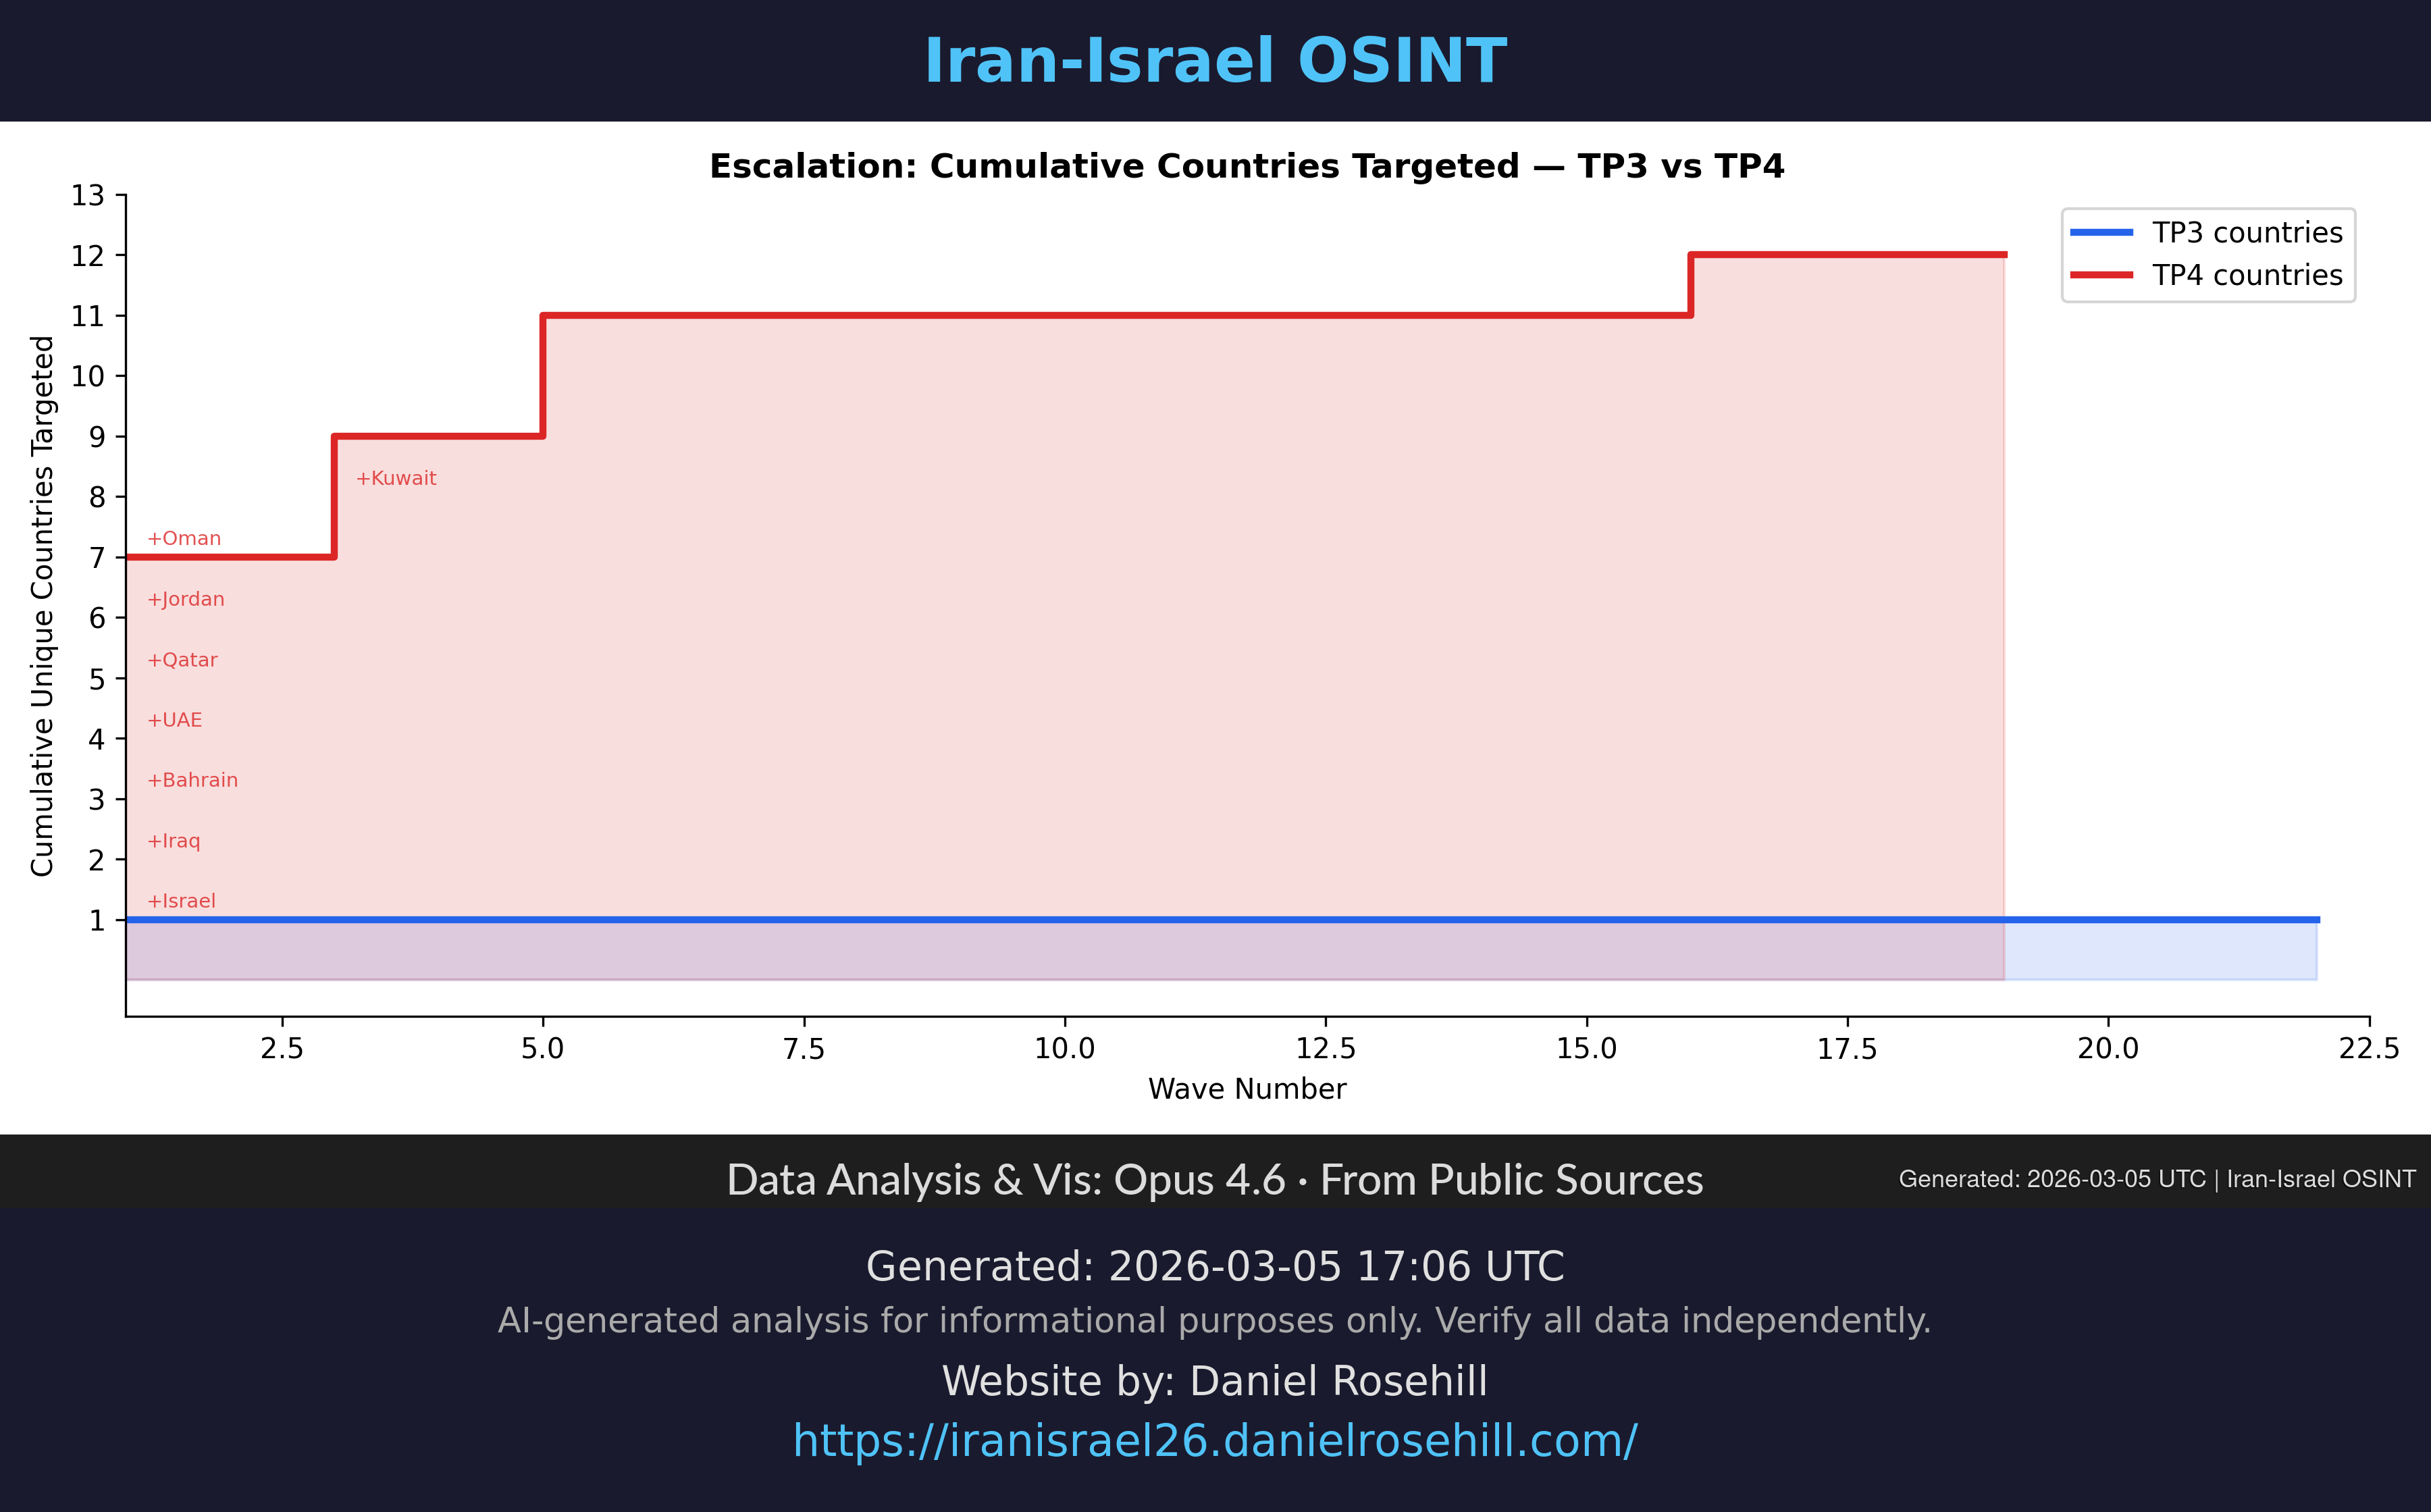
Escalation Staircase
Cumulative countries targeted over time — visualizing the step-by-step geographic expansion of Iranian strikes.
Escalation Generated: 2026-03-05 UTC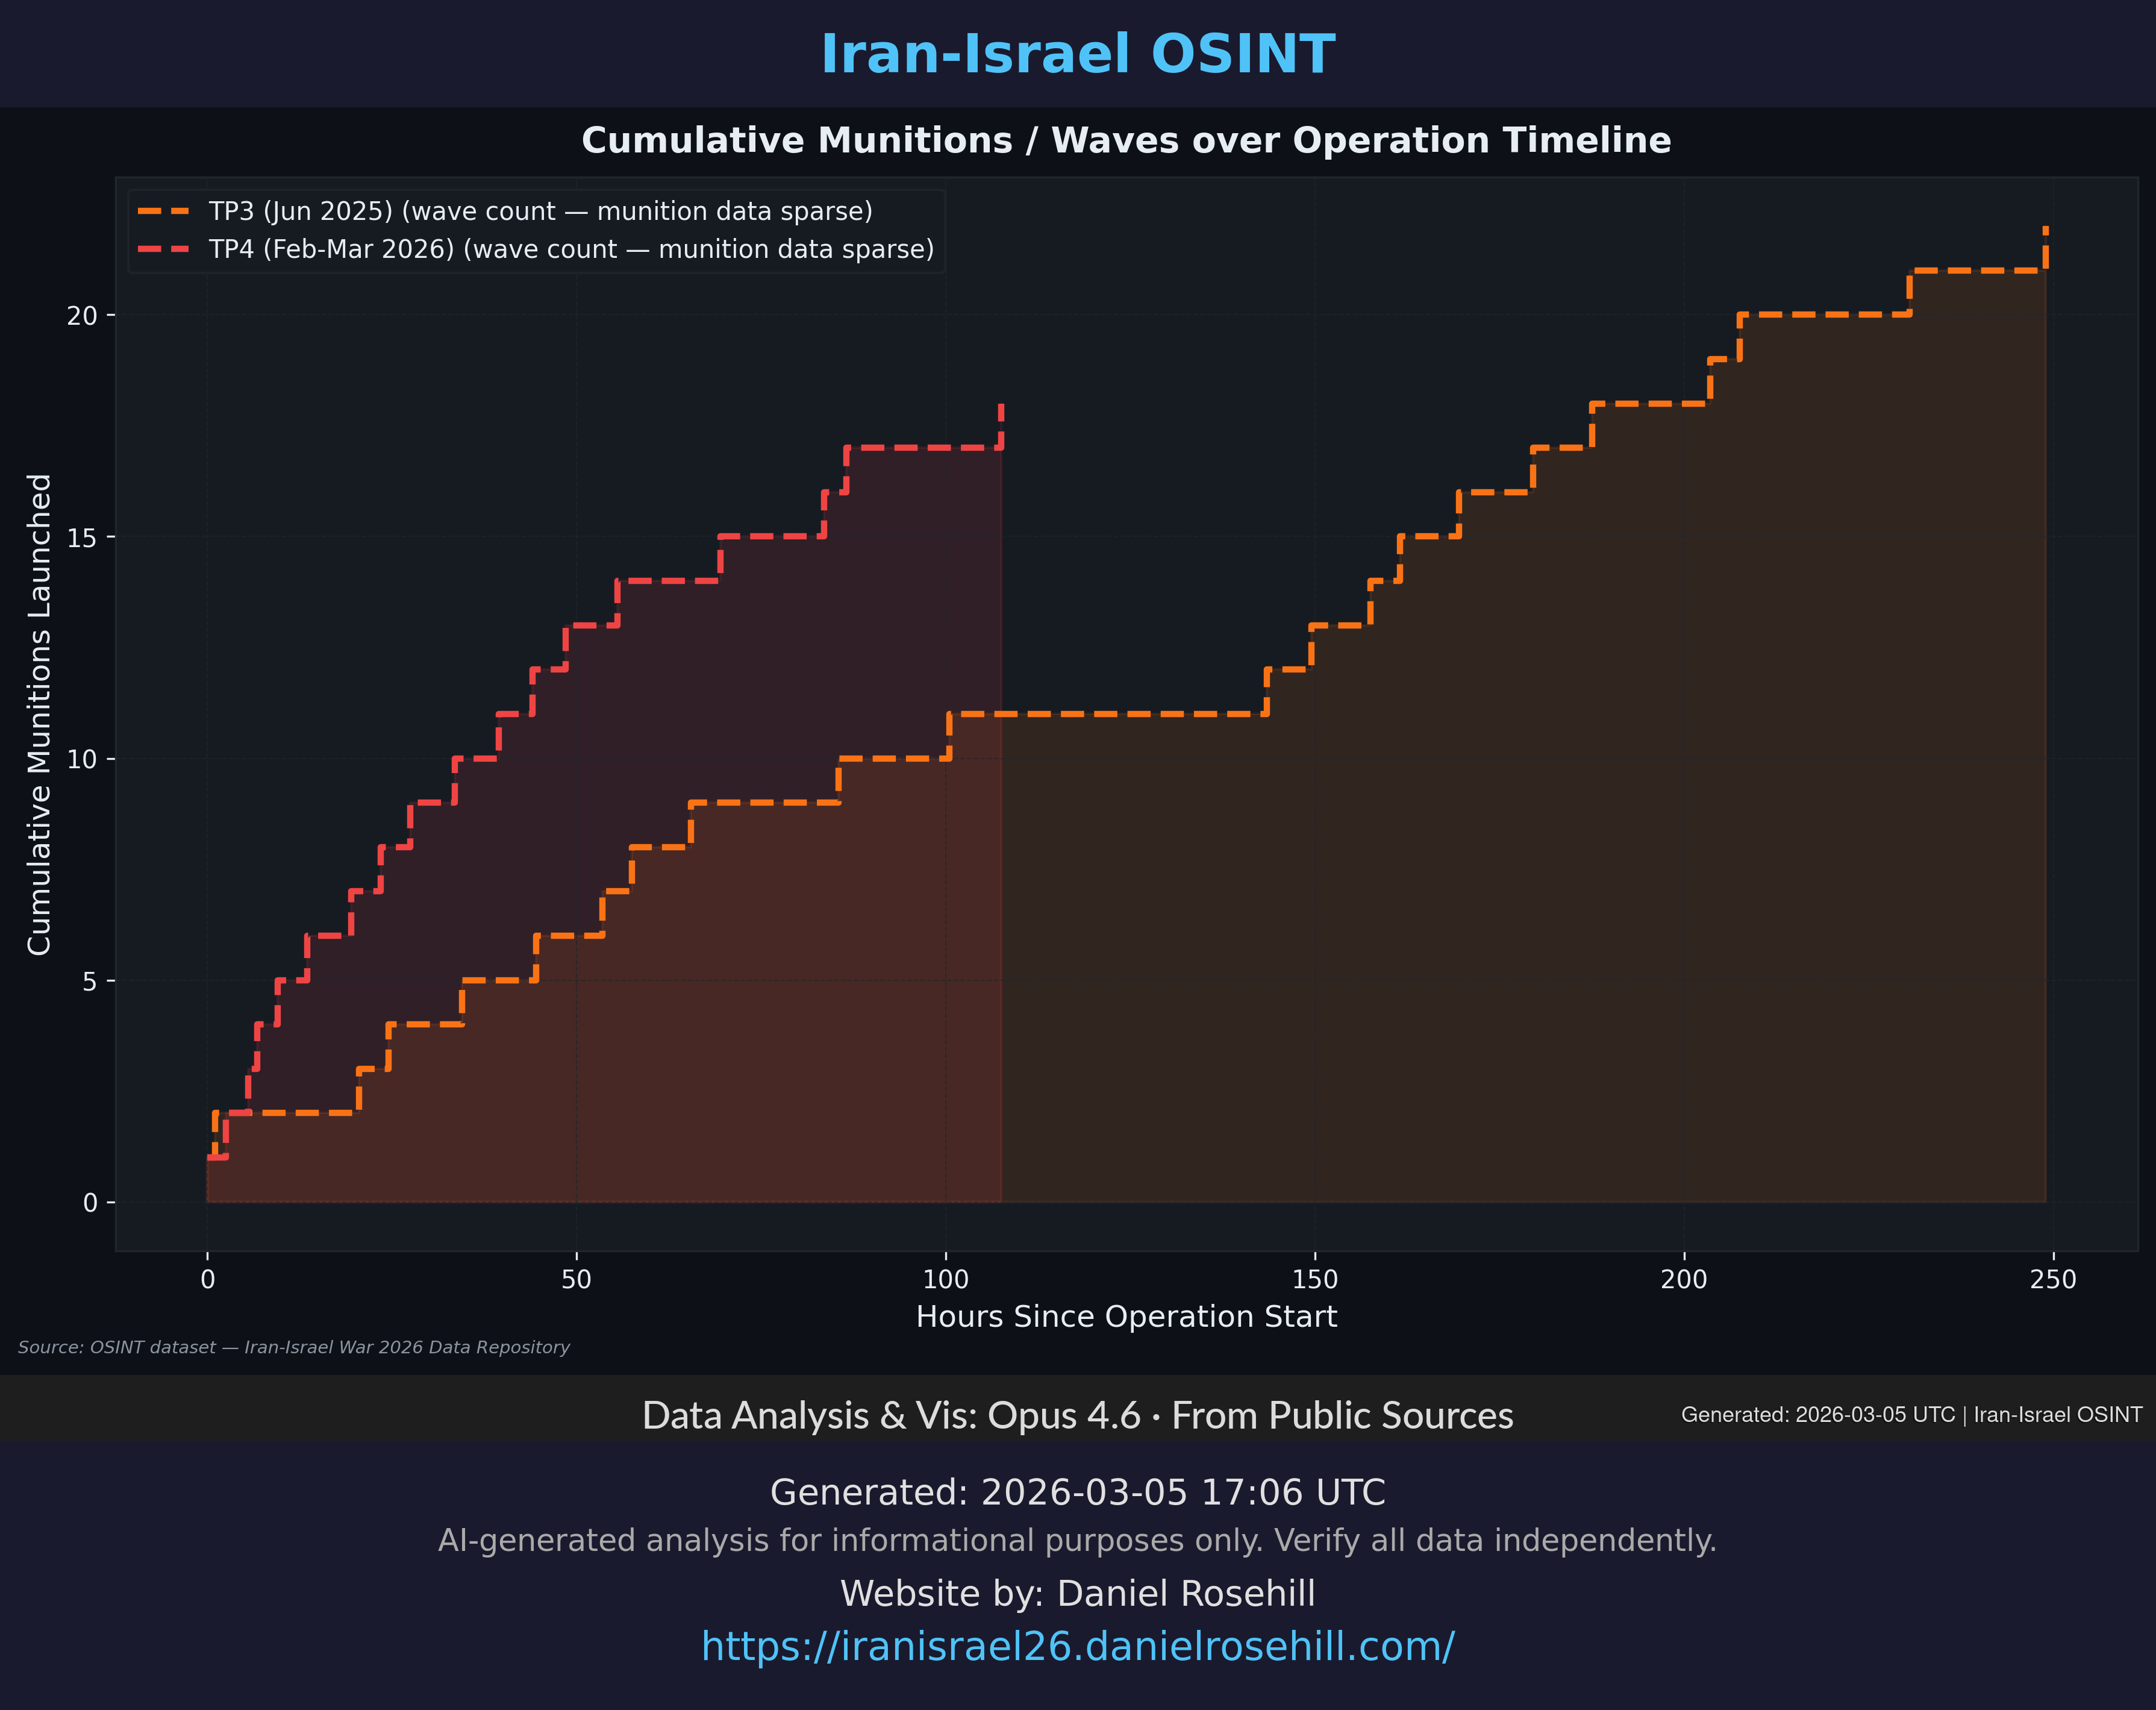
Cumulative Munitions
Running total of munitions fired across all waves — shows the acceleration curve of each operation.
Escalation Generated: 2026-03-05 UTC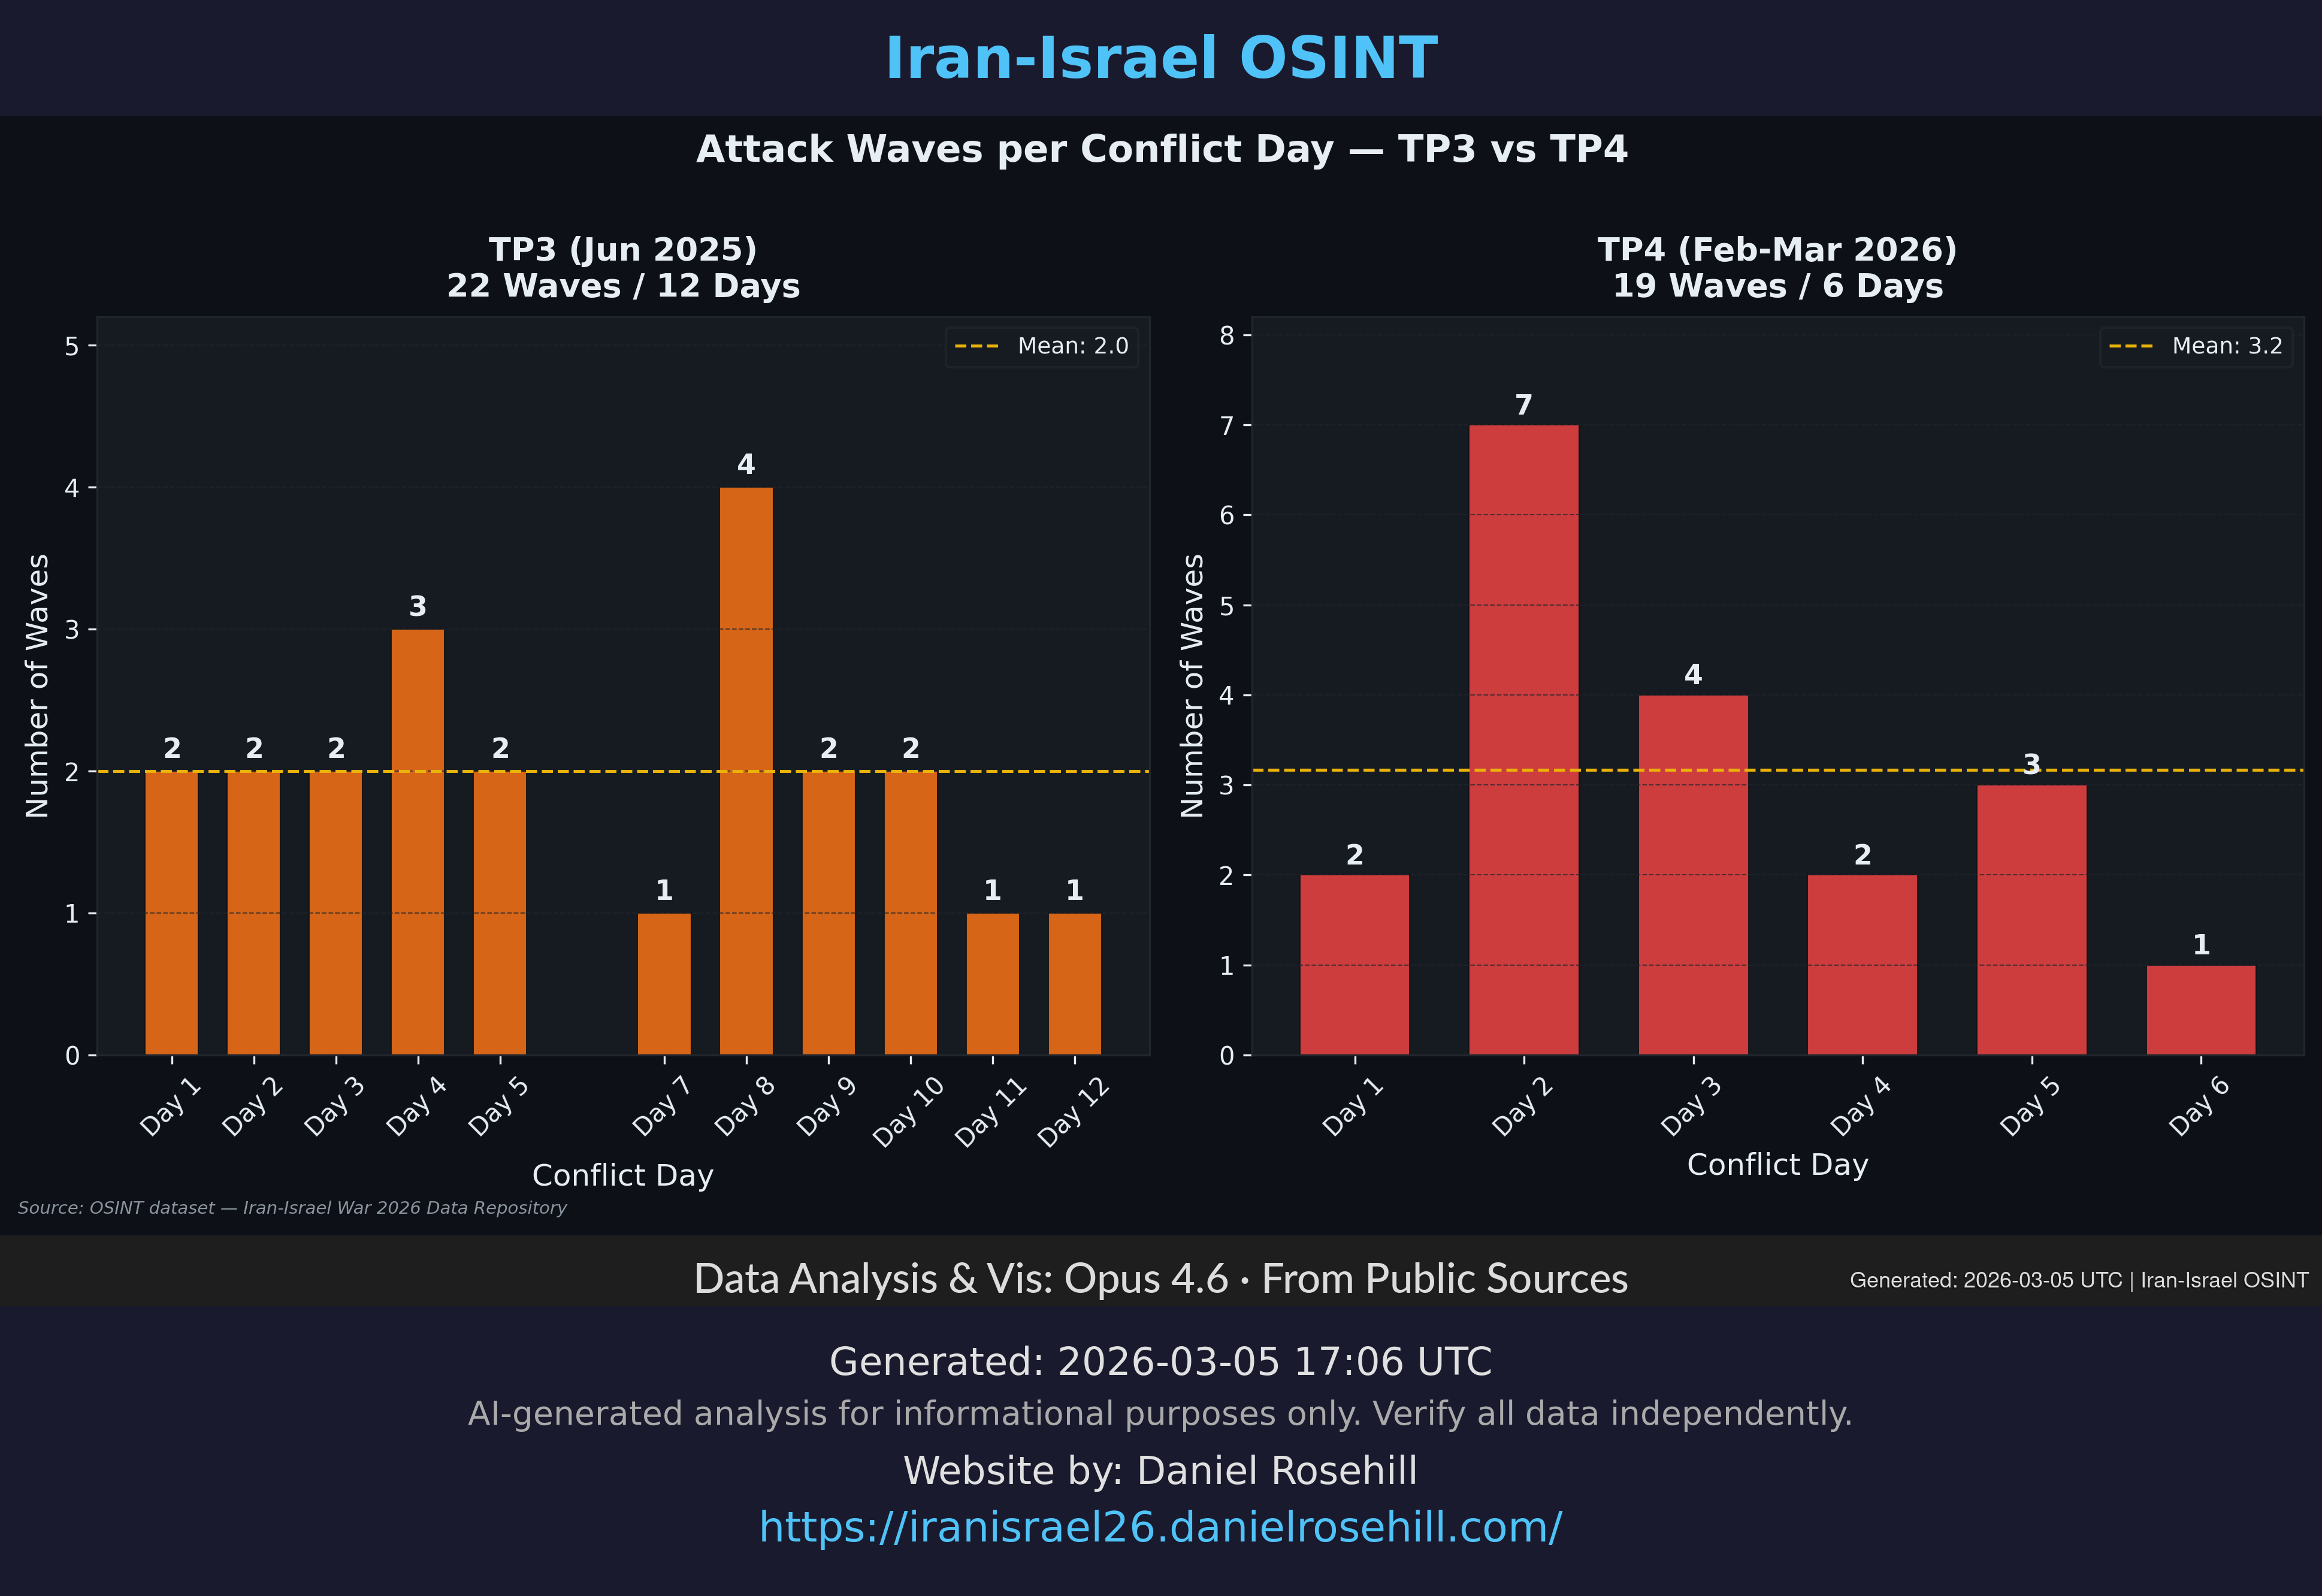
Waves Per Day
Daily attack wave frequency — shows operational intensity and surge patterns.
Escalation Generated: 2026-03-05 UTC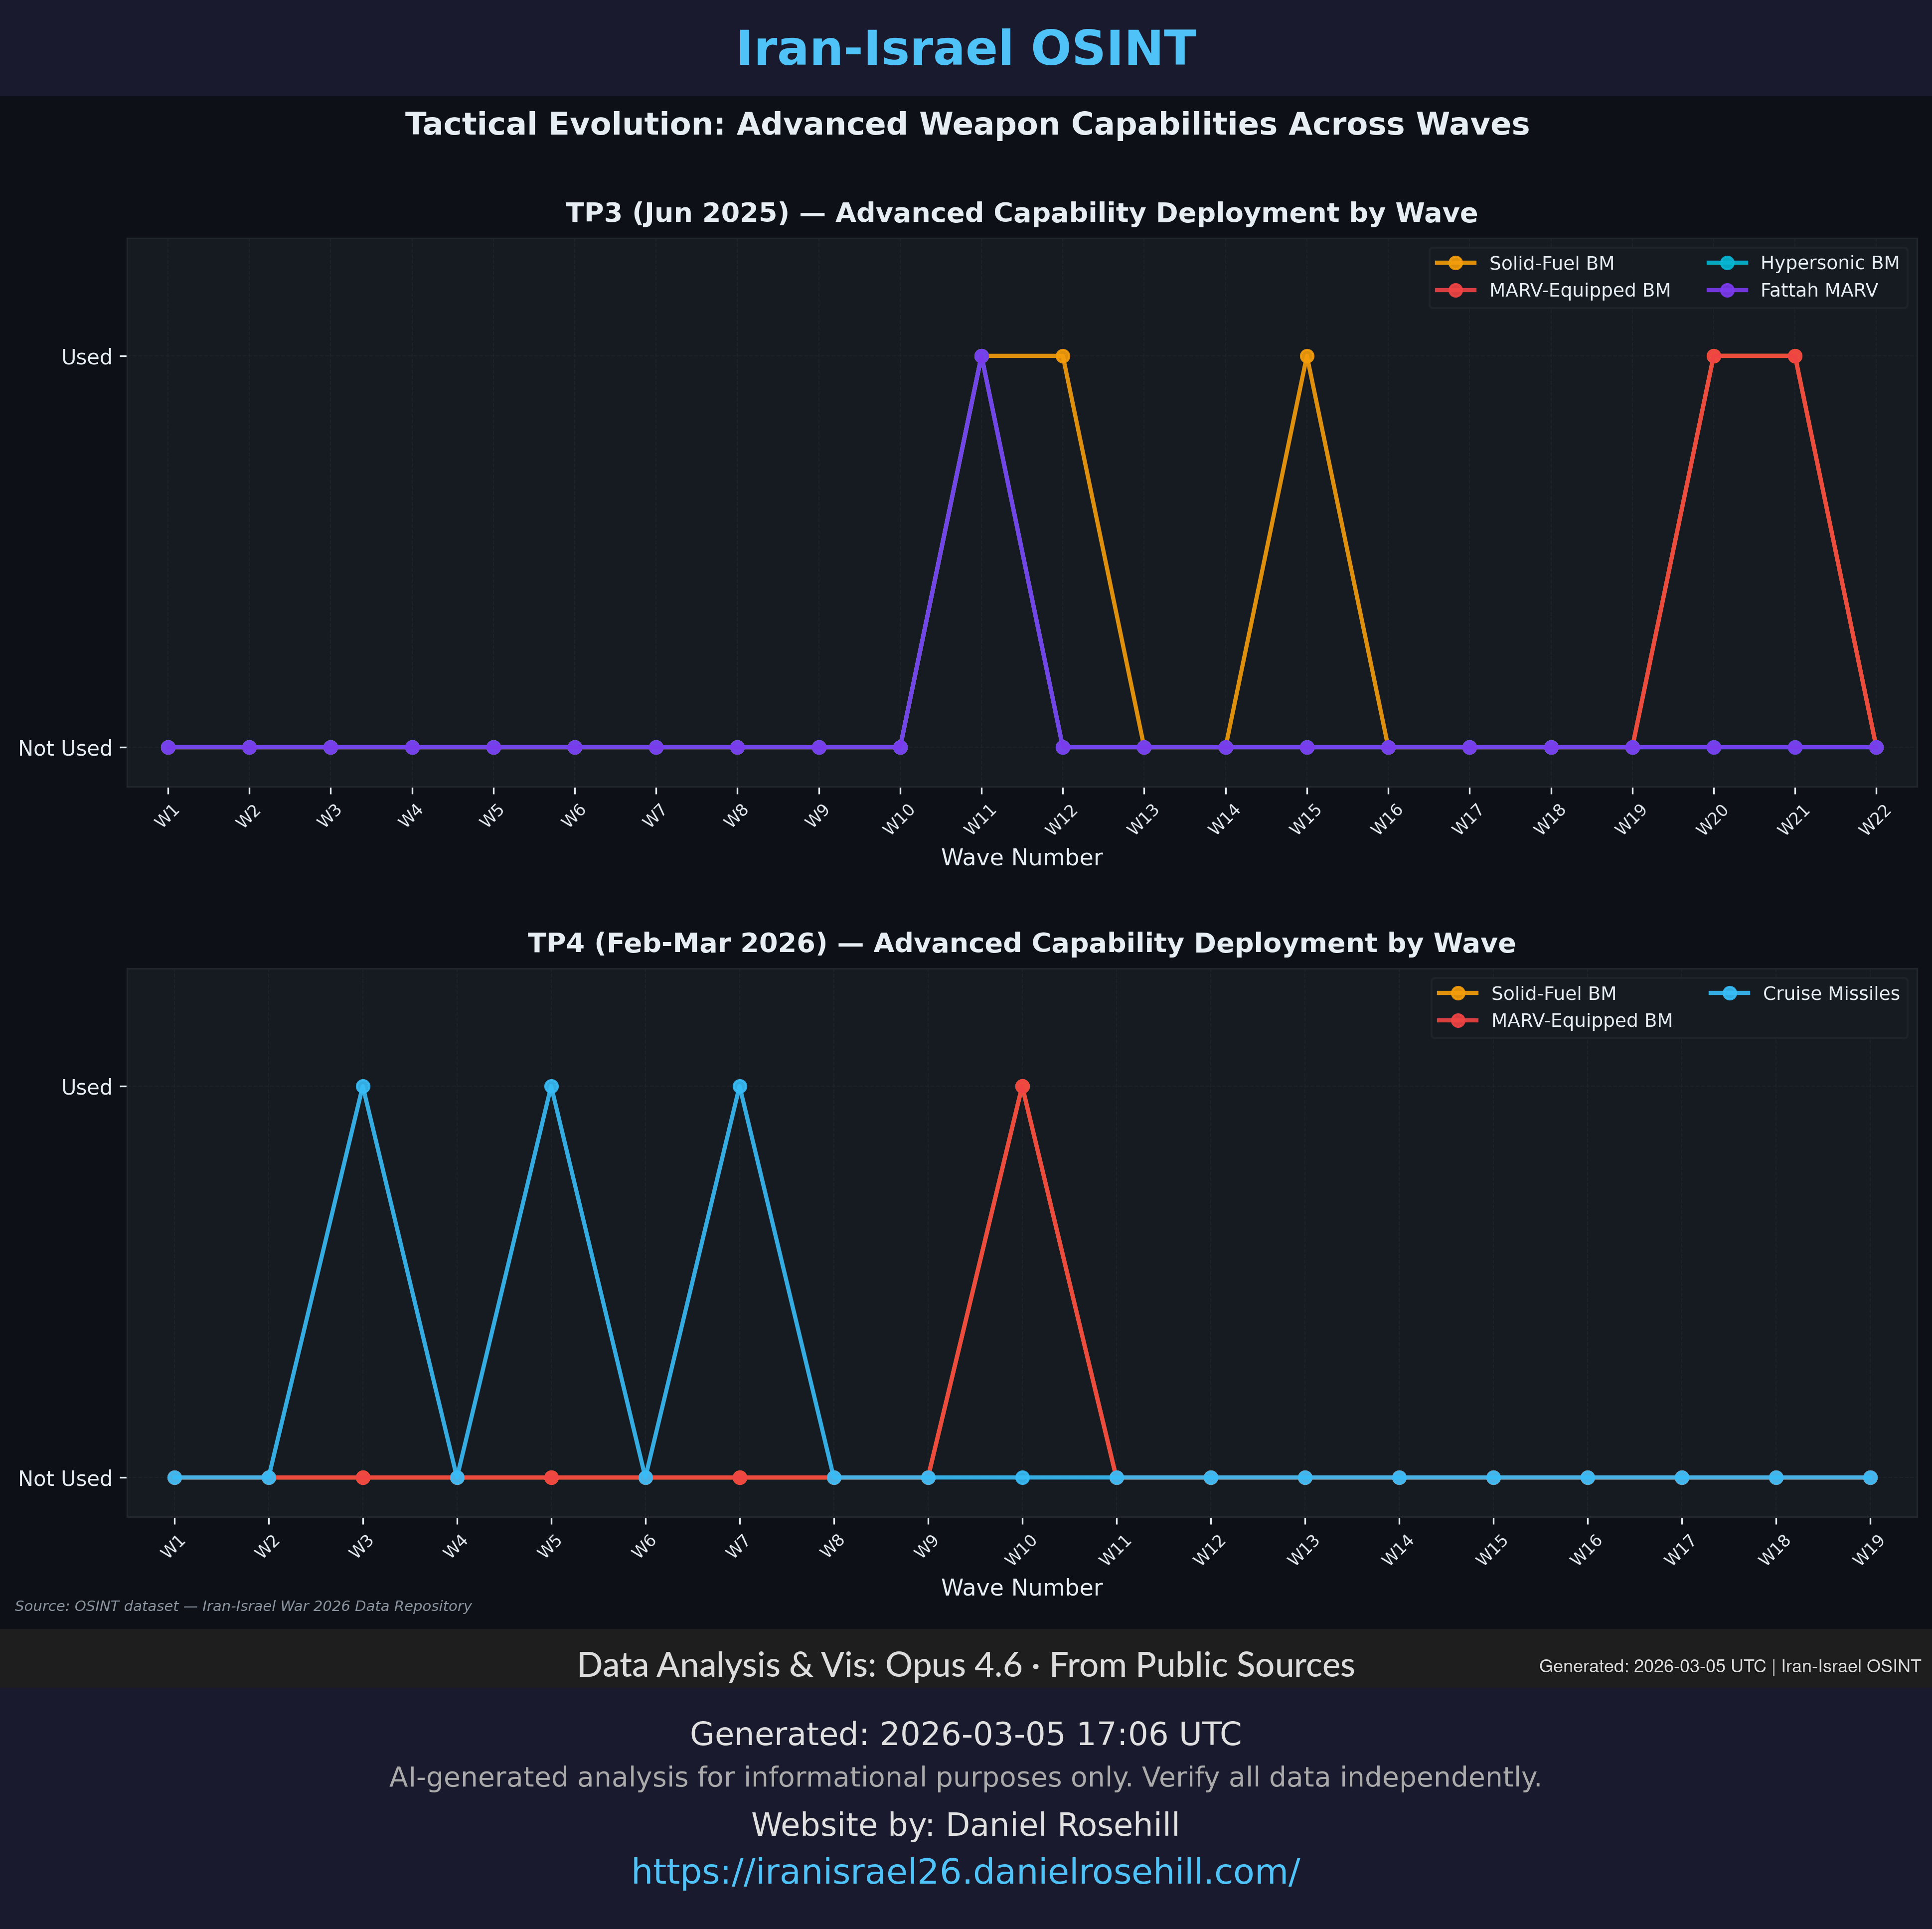
Tactical Evolution
How Iranian strike tactics evolved from TP1's initial probing to TP4's multi-theater sustained bombardment.
Escalation Generated: 2026-03-05 UTC